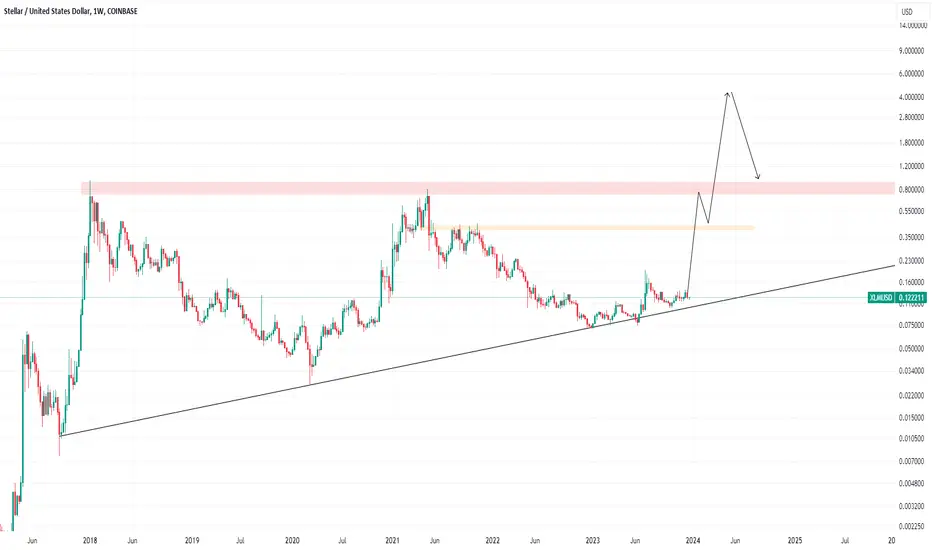
We Gettin RichAll the details are laid out in the chart. The only thing I would add is:
1) If a scenario like this happens, it will happen at the speed of light.
2) Theoretically, I could be right. Realistically, maybe not so right.
3) I plan on buying @ 9.5 cents and I plan on selling @ 40 cents. I planned to buy at 11.5 cents, but with the price action of BTC, I think we still need to touch 9.5 cents before the storm.
XLMUSD trade ideas

New Sell TargetI have changed my mind about XLM a hundred times and I would like to change my plan one more time. using fractals, past price action, and a trend line connecting the closing candles of the double top is giving me a target of around 60 cents a piece. I am greedy and an XLM moonboy, but it is what it is and i like playing games with my money. analyze your own charts, but also look at my chart as if you're just reading cnn fake news, cause if this analysis happens to be wrong then it will be very sad. we have not even caught up with the performance of the beginning of the last bull market. the more time passes the more undervalued XLM and XRP become and an asset is gonna stay undervalued only for so long. take a look at the chart, have fun with it and look at how things are playing out, but don't bet on this chart as if the there is a 100% chance of hitting the target.
PLAN, PRAY, PLAY.

XLM - Looking A Bit Closer At The Waves In This Move...In this video, I explore the nuances of smaller degree movements, attempting to discern their current status and potential future directions. If you're acquainted with the robust beginnings of Wave 3 movements, it's crucial to be vigilant for indicators. The inception of Wave 3 typically offers limited opportunities to enter the market, acknowledging the deceptive nature of waves. However, we'll remain attentive to additional cues throughout the analysis.
As highlighted in earlier videos, surpassing the 20 cents mark signifies a substantial upward trajectory. Conversely, failure to breach this level suggests a corrective phase, with the next potential move dipping below 10 cents.

XLMUSD - MACD Pattern The MACD areas on this Weekly chart look very similar. Will A large rise come once the bulls kick in on the second point?
Right now price is slowly creeping upwards on Weekly which is also a good sign.
XLMUSD has a very similar chart to XRPUSD and I expect if one pops off the other will follow.

IMPORTANCE OF MA 15 AND 40I have been testing a lot of moving average combinations for xlm for the past few weeks and the price has been compatible with MA 15 and 40 more than all other combinations i have used. i have tested MA 15 and 40 combo on other assets and i feel like this combo is specifically compatible with XLM and XRP, so for other assets i use other combinations. if we pay close attention to MA 15, it has been acting as support for 7 weeks. in the history of XLM when MA 15 acts as support and it is located above the MA 40 line, it has led to a strong bullish move. I remain bullish as long as MA 15 stays above MA 40 and the price does not go below MA 15. I look at XLM as an investment that can be held on to for over 3 decades. these indicators are tools to take advantage of well established market cycles that can make the investment more efficient at being profitable.

AccumulationAccumulation phase of the market comes in different shapes and sizes. I just wanted to share this chart to show two accumulation phases with different shapes and sizes. upon breaking out of the current accumulation phase, I will sell all of my XLM holdings at 17 dollars a piece. whether we like it or not, the alts are the slaves and btc is the slave master. the alt season is when the slaves break free from the slave master. so far the alts...i mean the slaves are in chain, and i don't know when they'll break free.

XLM to Move Above .20Stellar Move Incoming!
Look For a Wedge Breakout ot start this move.
and
An Invere Shoulder Head Shoulder patter could extend back to the summer high.

XLM - Stellar Will Explode In Value Once This Happens...Recently, I've immersed myself in a thorough analysis, aiming to decipher the dynamics of the market by scrutinizing patterns within the top 50 cryptocurrencies. Along this investigative journey, I've unearthed some intriguing insights. I posit that certain cryptocurrencies are strategically poised for short-term gains, while others are strategically aligning themselves for long-term growth. The crux of this fascination lies in the observation of cross-pair patterns, which I will soon elucidate.
To begin, I'd like to present a perspective that clarifies my assertion—some cryptocurrencies have yet to complete Wave 1, indicating they are far from initiating Wave 2. This observation holds significance for the overall cryptocurrency market cap over an extended period. It suggests the possibility that certain alt-coins could experience a substantial surge in their market cap compared to their counterparts. The reason being their readiness for the impending major bull rally associated with Wave 3.

Ascending TriangleI can't stop thinking about this ascending triangle. a simple ascending triangle in a very complicated and unpredictable market. while i'm bent on selling my xlm at 38 cents, i feel like there's a chance that this scenario is more likely to play out. I am considering a change of plans and set my sell target to 70 cents and then buy back at 42 cents. please do not listen to anyone on trading view. we're all a bunch of nobodies pretending to know how market behaves. it's all probabilities. nobody can perfectly predict market behavior. i share this because i like playing with charts. if you blindly follow this idea, there's a big chance you might lose your money. all of it.
XLM 0.17 or 0.38 or 0.69?IN @ 0.121700
I will ride XLM up to around 0.17 or 0.38 or 0.69?
Hopefully by Christmas! Soon very soon! :) lol
Around what price range do you see XLM going?
Comment

Stellar is looking bullish! The fib is on the line chart and you can see the candle bouncing off nicely gradually exciting the RSI to start moving possibly upwards. Stellar Lumens otherwise referred to as Lucifer is the master of deception, but not if you know his game-plan to dominate the world through these puppets at the CB(s), WEF, WHO and every participant in world government doing his bidding.
Get ready for the mark with your global passport infused with many variables that would allow you to move, buy, sell, healthcare etc. The last 3 years with Dr Bill Gates funding the WHO should be a wake-up call.
Woe to XRP too! Can you See the Writing on the Wall yet?
Stay Strong for: "Men's hearts failing them for fear, and for looking after those things which are coming on the earth: for the powers of heaven shall be shaken."
- Luke 21:26

Will XLM Fail To Surpass $0.135?Failed Inverted Head and Shoulder Breakout: XLM's price was unable to break out of an inverted head and shoulder pattern, indicating seller dominance at the $0.135 level.
Sustained Uptrend with Warning Signs: Despite retaining its uptrend momentum, XLM's price shows signs of potential bullish failure.
Critical Resistance at $0.135: The $0.135 level is proving to be a significant barrier for XLM, impeding its upward movement.
Potential for High-Speed Jump: A successful breakout above $0.135 could lead to a rapid price increase for Stellar, potentially reaching $0.1426.
Recent Price Dump: XLM recently experienced a 7.47% drop, struggling to surpass the $0.135 resistance and forming a bearish engulfing candle.
Incomplete Morning Star Pattern: A morning star pattern appears to be forming but lacks strong bullish momentum to confirm a positive reversal.
Current Trading Price: XLM is trading at $0.126, showing a slight bearish trend in the intraday chart.
Low Trading Volume: The lack of substantial trading volume indicates a potential consolidation phase or decreased investor interest.
Technical Indicators - MACD and RSI: The MACD indicator is indecisive, leaning towards a bearish crossover, while the RSI fails to show a significant increase in momentum.
79% Year-to-Date Growth: Despite the current challenges, XLM has shown a 79% growth year-to-date, maintaining a generally bullish trend for 2023.
Potential Future Moves: If XLM manages to break above $0.135, it could see a 15% increase to $0.1426. Conversely, a decline from $0.129 could lead to a drop to $0.1092.

Xlm stays strongXlm breaking away from the donwtrend channel, its clearly making a nice rounded bottom for a strong support, as long as the dow keeps going up with bitcoin this surely could be the next pumping.
IHS pattern on the daily, small cup and handle on the 4hour frame

Bull Market Indicator Moving AveragesThe 25 (orange) and 99 (blue) Moving Average Cross has been shown as an indicator for the bear and bull markets in XLM. usually when the 25 MA crosses the 99 MA in a way that the 25 MA is on top, it is an indication of the start of bull market. when the MA lines cross in a way that the 99 MA is on top it's an indication of a bear market. yesterday MA 25 crossed the MA 99 and is now on top, is this a signal for another bull market? I say, yes, but you shouldn't believe what people say on trading view and do your own research.

XLMUSD - Getting Closer To A Low.... New View...
I anticipate a gradual decline in prices from this point forward; however, I believe that XLM will outperform most major cryptocurrencies during this period.
Recently, a breakthrough in my analysis technique has allowed me to categorize each crypto, providing a clearer understanding of the patterns they are producing, with only two categories in existence. This breakthrough has empowered me to make significant adjustments to my analysis methodology, allowing me to closely align with the authentic pattern that XLM is forming. I no longer find myself guessing when deviations occur; the categorized framework enables me to make informed evaluations. This streamlined approach, thanks to the categorization, makes utilizing AriasWave even more straightforward in my analyses. Consequently, I can generate more ideas without compromising on quality.

Unrealistic-Not Impossible I came across this ascending channel and I think it’s interesting to look at. While a 20 dollar valuation for XLM in 2025 is unrealistic, it is not impossible given the nature of crypto market.

breakout watchno vaves on this but a cool looking inverted HnS
watch for breakout and push to around .26 in a fast move
nfa
y axis only

18 Month Old Inverted H&S1) we are sitting on an inverted H&S that started forming in May 2022.
2) with a structure like that, the tiniest target I can think of is no less than 28 cents a piece.
3) my other reason for believe we’re headed to 38-40 cents is that BTC is gonna push to 48k, and stabilize there giving way for the Alts to catch up.
4) XLM is not gonna catch by going to 17 cents or 24 cents. The only option is to hit the 38-40 cent level.
5) once we get to that level btc will start correcting back to 38k which is around 20% of correction for btc.
6) if btc corrects 20% then XLM will follow with a 36-40% drop (very normal and recurring event). The 40% drop of XLM from 40 cent is gonna be around 24 cents which is a 38.2% Fibonacci retracement level.
7) all of this needs to happen in a time span of a 7-8 week.
8) this is just a scenario that I think will happen. We all no there’s a high chance it will never happen, but I had to share the idea.

Can XLM ( Stellar ) do 25% move?As you can see XLM did higher high in July. Now it could be doing an H&S pattern. Closing the candle above the neck will be confirmation of a long position and I will be taking profits at those green marks.

Them Sexy Monthly Candles In my last post about XLM, I pointed out that my sell target was around 38 cents. I still haven’t changed my target, but I was playing with the monthly chart and I just want everyone for a second to imagine a big giant green candle like this. A candle like this would be better than a thousand orgasms combined. The ascending triangle is drawn only considering closing prices of monthly candles. With that being said, if we want to visit the resistance trend line then the price would have to take itself to 53 cents a piece. Breaking out of this triangle is the heaven we’re all waiting to see.

XLM $0.170000 soon! :)I will ride XLM up to around $0.170000? & Get out!
What do you think XLM is going?
Comment below!
Much Love!

XLM?This what I think about XLM I will ride it up around 0.135000 get out & get in around 0.085000 That is when I will whale in lol.
+ lil trades here & there!
Comment!

Long Term OutlookHistory is not repeating. History is rhyming. The mini bull cycle in 2020 was wave 1, the bear market wave 2. We are at the beginning of wave 3. And I think wave 3-4-5 all are happening by mid 2025. My target for the top is 161.8% of wave 1, which comes out to about $17.
