XLM USDMy idea about XLM finance, long term 1,30 $ is very possible.
My buy zone 0,15 $. Target LONG 1,50 $.
What do you think? Please comment. Good luck. :)
This is not financial advice ! Warning! The price may fall more !
Please do your analysis and consider investing !
PS: everything is possible in cryptocurrencies, if the price drops to 0.050 $
XLMUSD trade ideas

XLM/USDT - Potential Short ScenarioHello Traders!
The XLM ends the decline phase usually followed by an accumulation.
The return of the price to the main trading range of $0.050 - $0.116 will give the opportunity to find entry points for medium-term purchases.
It's worth accumulating closer to the support level of $0.050, in the range of $0.050 - $0.073.
Price levels of $0.137 and $0.200 will be the profit-taking targets of such trades
Good luck and watch out for the market
P.S. This is an educational analysis that shall not be considered financial advice

XLM target double digitsThis chart speaks for itself.
We first look at the movements of XLM in the 2017 Bull Run. 1) A massive impulse up, 2) an 88% correction, 3) a second impulse up to ATHs.
Presently, we have seen 1) A massive impulse up, 2) an 88% correction, and we are waiting on what comes next.
One thing to note - the 88% correction took approximately 3x longer this time around than it did in 2017. It is fair to assume that the impulse up to new ATH (and double digits) may take longer to materialize than the last bull. We may see a lower daily or weekly close, but I believe that the low wick we have seen is the actual low for in the 88% correction.
Good luck!

XLM/USD TECHNICAL ANALYSIS - 1W ChartPrice might go down at demand zone around 0.080 or maybe around 0.045. Heard some info saying there will be some event on Stellar network going live this June. Not sure what it is and I am not fundamental analysis expert -u can check it out but if price did bounce back on 0.080 demand zone, it is a possibility it will have momentum making new higher high. As u can see on the chart, there are previous significant support and resistance on that demand area. So, again, it might bounce back from that demand zone around 0.080.
***This is not financial advice. This is only for sharing ideas regarding crypto currency. To be specific, ISO20022 crypto currency***

Stellar ( Lumen ) XLMLooking to buy the coin around 0.12-0.1 cents.
All the way up to the highs and even higher

XLM Bulltrend confirmedSee chart, RISE OF THE PHOENIX.
We bottomed, LUNA crashed BTC dipped, trust in crypto blurred in minds, it is TIME for the PHOENIX!

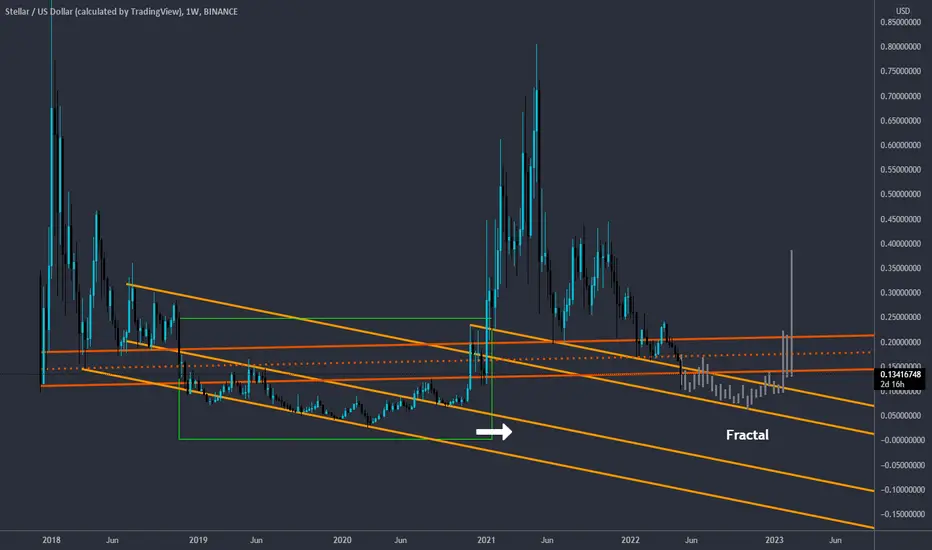
XLM fractal#XLM/USDT
$XLM fractal from end of 2018 can be repeat if weekly candle close below $0.13.
Stellar (XLM) - May 12hello?
Traders, welcome.
If you "follow", you can always get new information quickly.
Please also click "Like".
Have a nice day.
-------------------------------------
(XLMUSD 1W Chart)
If it falls below 0.124080, it is expected to enter the mid- to long-term investment zone.
(XLMUSDT 1D Chart)
If it falls below 0.1240, it is expected to enter the mid- to long-term investment area.
However, it can touch the 0.1090 area and rise, so careful trading is required.
A move above 0.1597 to find support is important for a transition to an uptrend.
------------------------------------------------------------ -----------------------------------------------------
** All indicators are lagging indicators.
Therefore, it is important to be aware that the indicator will move accordingly as price and volume move.
However, for convenience, we are talking in reverse for the interpretation of the indicator.
** The MRHAB-T indicator used in the chart is an indicator of our channel that has not been released yet.
** The OBV indicator was re-created by applying a formula to the DepthHouse Trading indicator, an indicator disclosed by oh92. (Thanks for this.)
** Support or resistance is based on the closing price of the 1D chart.
** All descriptions are for reference only and do not guarantee a profit or loss in investment.
(Short-term Stop Loss can be said to be a point where profit and loss can be preserved or additional entry can be made through split trading. It is a short-term investment perspective.)
---------------------------------

XLMNot financial advice.
The essence of investing & trading is the intelligent and patient preying on the greed, fear, impatience, addiction and ignorance of the majority. It's definitionally Darwinian.

XLMUSD ❕ triangleAfter exiting the range Stellar began to form a triangle.
After retesting the upper boundary of the triangle, trading volumes decreased again.
I expect that after fixing under the resistance level the volatility decrease may continue and we will test the lower boundary of the triangle again.


This Move Of Stellar Lumens XLM Can Be A Confirmation Of AnotherHi friends hope you are well and welcome to the new update on Stellar.
Broke down the channel and H & S:
On a 4-hour time frame, XLM formed a down channel and during the movement within the channel, the priceline also formed a Head & Shoulder pattern. Finally, XLM broke down the neckline of H & S and the support of the channel.
The target for the Head & Shoulder pattern to the downside was $0.15 and the price action even moved lower than this target. Right now the pricline line is moving up and if it will be rejected by
the support of the channel (which is now working as a resistance) then it can set another lower low.
Short-term support and resistance levels.
On a 1-hour time frame, there is $0.14 support and the priceline has bounced from there and now moving between the $0.15 support and $0.16 resistance levels. If it breaks out $0.16 the next
resistance levels will be $0.17 and then $0.18.
Huge falling wedge:
On a weekly view, Stellar has formed a huge falling wedge pattern and now moving down to the support of this pattern. If XLM tests the support of the wedge then it can drop at $0.12. But after
testing the support a big reversal move is possible.
Conclusion:
On a smaller time frame, If the priceline will not be able to breakout the support of the channel as resistance, then the next move can be $0.12. But on a bigger view, after testing the support of the wedge big bullish reversal will be started.

Nothing is StellarStellar Lumens looks like it wants to go lower, no real reason for this to spike again (double top).
No real reason for this to go up, unless XPR (Ripple) does. Other than that, I recommend selling/shorting this one.
Other: great project with a great team, but that doesn't mean price needs to moon.

This Is Why Stellar Lumens XLM Should Be Your Top PickHey friends hope you are well, and welcome to the new update on Stellar coin.
Breaks down significant support:
On a weekly time frame XLM is breaking down a very significant support of $0.16. This $0.16 level has been working as strong support and resistance since Mar 2018. Now the next major
support will be at $0.12.
Broke down channel and H & S:
On a 4-hr time frame, XLM has broken down a down channel and a Head & Shoulder pattern as well. The target to the downside for H & S pattern was $0.15 and XLM has reached there.
XLM might test the support of big wedge:
On a monthly time frame, XLM is moving in a huge falling wedge pattern. Now after breaking down $0.16 support, it is possible that Stellar may retest the support of this wedge.
We should remember that previously when stellar broke out a huge channel we had around 1400% move and from the low to the high, that was about 3000% rally. Same is the previous move XLM can start another massive rally after breaking out this new falling wedge.
Conclusion:
Ona bigger time frames, stellar is moving in a falling wedge pattern, which is considered to be a bullish biased. Therefore, there is a high probability that after testing the support of
this wedge, XLM once again starts a long-term bull run.

XLM inverse and head and shoulders possible bottom is in.XLM is forming a possible head and shoulders. A possible bottom is in for XLM. I think right now is a really good time to buy and accumulate this coin.

Stellar Lumens XLM Dumped Once Again But Still Has Big PotentialHi friends hope you are well and welcome to the new update on XLM:
Fake out:
On a 4-hr time frame, a few hours back XLM was breaking out the down channel but infact it was a fake out. Because, after breaking out while re-testing the previous resistance of channel as support stellar has re-entered the same channel.
Long-term support zone:
Now there is a long-term support zone that starts from $0.18 and goes to $0.16. Right now priceline of Stellars is moving in this zone. This support area has been working as strong support and resistance since Mar 2018.
Huge wedge formation:
On the monthly time frame, there is a huge falling wedge has been formed. Previously in the same time frame, XLM broke out a big channel and started a big bull run. Therefore, after breaking out the current wedge we can expect the same move.
Conclusion:
On the short term, there is a sell-off, but in the long-term XLM has a huge potential to start a massive move.
Note: Above idea is for educational purpose only.

XLM SHOULD BOUNCE BACK UP!- As you can see XLM has broken out of the trend line to the downside!
- We should touch back down to $0.13 and then continue to the upside!
- DCA INTO XLM - still a great entry (NOT FINANCIAL ADVICE)

$XLM Bullish Shark / GartleyXLM giving us the confirmation low of the larger Bullish Shark here with a 1.13 rejection at the PCZ.
The smaller Gartley reached the .886 and engulfed nicely as most time scales are diverging bullishly.
The whole market looks primed for much, much higher prices after Powell spoke today
DXY is topping out and beginning distribution which is confluent with the ideas we've been going over across the crypto market.

$XLM Read description- MY OPINIONSomething else to think about. Not everything is TA. No good or bad news has hit XLM. Where would be the rush to sell? The weight of BITCOIN and ETH is the problem. If XLM & XRP disrupt those two heavies, then anticipate them to go down. Money will have to be funneled to new projects. Don't be surprised when those two projects fall, also anticipate that event to pressure ALT coins.
Just like the stock market. Top companies carry too much weight which affects the market. Is that centralized behavior or decentralized behavior? Also in the stock market, there is ALWAYS a purge. Many things/events/excuses cause these events. (ie. Wars, 9/11, 2008, public health...) Old poorly ran companies fault for overspending or do not have solid foundations will not withstand the shake. At that point, new and improved companies that are just starting take over "probably with solutions of those that fell"
I can see it 3 different ways. 1. BIT and ETH drop like a rock crashing ALL the markets w/ a dead cat or two. ISO20022 then replaces the system. 2. A slow funnel out and into ISO20022 compliant. 3. ISO20022 will prove itself to the Crypto Market, and demand respect, which will then hurt BITCOIN and ETH. With ongoing litigation.
How will this all play out, no one knows. RESEARCH ...

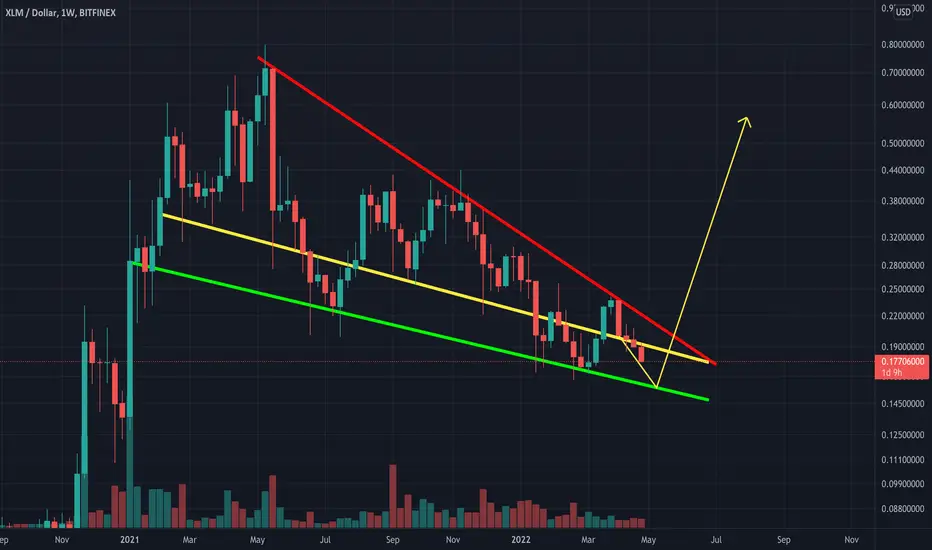
Stellar: longThe price formed a falling wedge. We expect a breakout to the upside. 100 day-moving average and 50 day moving average are about to cross (Golden cross).
Invalidation: 0.14
Target price: 0.48
entry point: break out of the falling wedge with a high volume

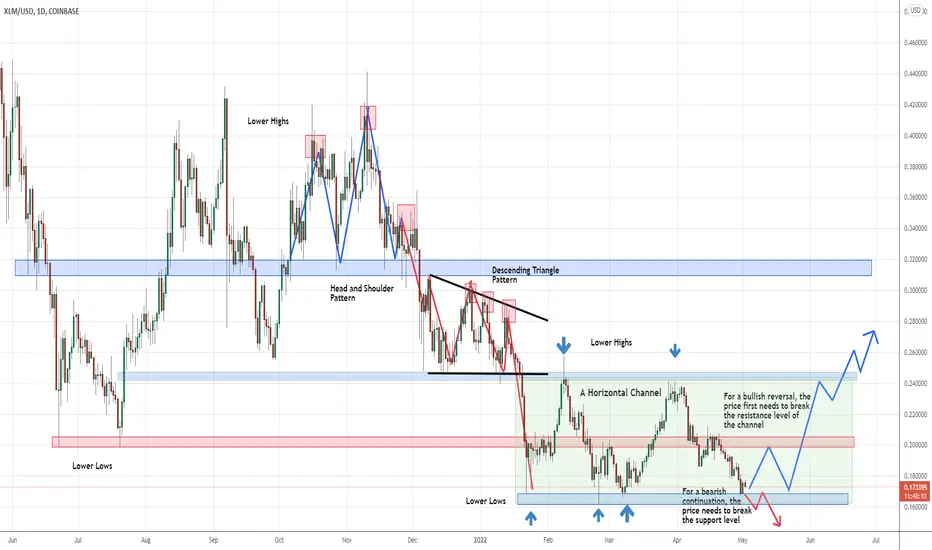
A Break From the Current Range Will Determine the DirectionStellar Lumens has been moving in a bearish trend since the summer of 2021, creating lower lows after periods of consolidation. Currently, the price is channeling in a horizontal range after breaking down from a descending triangle pattern early in 2022. The price now has once again arrived at the support level. For a bearish continuation, price needs to clearly break the support level of 0.1600. For a bullish reversal, price first needs to clear the resistance of the channel, which is 0.2400 level.
Xlm small dip before lift off Looks like were approaching the bottom for this formation mega buy area 15-16 cents before breakout. Massive move inbound
XLMUSD ❕ back into the downtrend channelThe XLM price returned to the downward channel on higher volumes and broke through the 50MA on the 1H Timeframe. Now there is a local decline along with a decrease in volumes. I expect the retest of the support level, fixing above it and reaching the resistance level.
