Stellar (XLM): Looking For Breakout | Breakout + Re-TestStellar is going to a breakout, a breakout which will give us a good opportunity for a long position. Now, we might see some smaller rejection and correction from current area, but we still will be witing for breakout, not going to enter earlier into trade here.
Better safe then sorry yea?
Swall
Related pairs

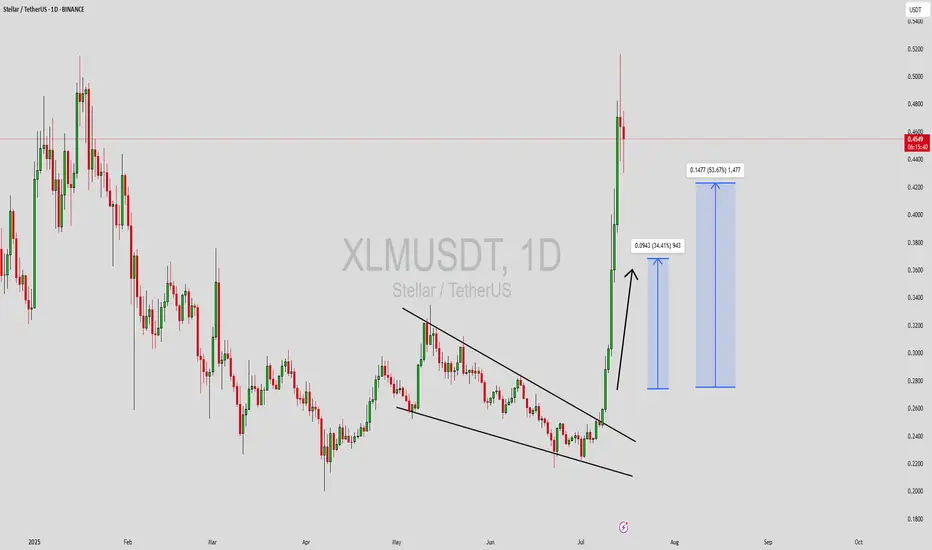
Stellar Eyes 14% Upside, Targeting 0.30$Hello✌
All previous targets were nailed ✅! Now, let’s dive into a full analysis of the upcoming price potential for Stellar 📈.
BINANCE:XLMUSDT has convincingly broken above its daily descending channel resistance 📈 and is holding near a strong support level. This setup suggests a potential ups

Stellar XLM price analysisToday, the price of CRYPTOCAP:XLM rose quite dramatically, doing so at a critically important moment, but trading volumes are slightly insufficient for final confirmation.
Now let's look at what we wrote for the OKX:XLMUSDT chart four months ago: “It would be ‘right’ to test $0.19-0.20 before t

XLM/USDT;FREE SIGNALHello friends🙌
Given the good price growth, you can see that the price has entered a channel, which has caused the price to form a flag...
Now, with a strong channel breakdown by buyers and their entry, you can enter the trade with risk and capital management and move with it to the specified targ

XLMUSDT Forming Falling WedgeXLMUSDT (Stellar) has recently delivered an impressive breakout from a prolonged downtrend, indicating strong bullish momentum following the completion of a falling wedge pattern. This pattern, known for its high probability of signaling a bullish reversal, was confirmed as price exploded upward wit
XLM - Stellar - Possible Short coming up - This is Why?Reading the chart (annotations in sync with chart):
1. Location: Fib over-shoot - possible sellers
2. Largest up volume - possible sellers in there
3. Mountain shape PVR - increasing volume as wave progress
4. Abnormal SIs at top (could be closing positions but it also could be sellers absorbing buy

Is Stellar ready to rally 26% toward 0.55 target?Hello✌
let’s dive into a full analysis of the upcoming price potential for Stellar 📈.
BINANCE:XLMUSDT has surged through multiple daily resistance levels this past week, resembling a powerful breakout 🚀. It is now approaching a key daily support that aligns with the 0.26 Fibonacci retracement lev

Stellar (XLM) Rejected Hard—Brace for $0.25 Next?On the daily chart of XLM/USDT, price has made a steep, parabolic rise, pushing directly into a well-established resistance zone around $0.5155. This level has historically capped price moves, evident from several prior swing highs clustering near this area. The rally itself unfolded rapidly, withou

$XLM/USDT Breakout Alert: 80% Move on the Table?CRYPTOCAP:XLM just broke out of its downtrend after months of being stuck in a falling channel.
The breakout came with a strong 12% pump, and price is now holding above both the trendline and the 40MA, a solid bullish sign.
If this move holds, we could see XLM push toward the $0.4540 zone (that

XLMUSDT SPOT PLAY – LORD MEDZ JOURNAL UPDATEFramework: SMC x Goldbach | Chart TF: 1W | Asset: Stellar (XLM)
📆 Update Date: July 2025
📌 Disclaimer: This is for journaling purposes only. Not financial advice. DYOR.
🔍 Observing the Macro: The Wyckoff Legacy Lives On
Looking left on the weekly chart, Stellar (XLM) executed a textbook Wyckoff Acc

See all ideas
Summarizing what the indicators are suggesting.
Oscillators
Neutral
SellBuy
Strong sellStrong buy
Strong sellSellNeutralBuyStrong buy
Oscillators
Neutral
SellBuy
Strong sellStrong buy
Strong sellSellNeutralBuyStrong buy
Summary
Neutral
SellBuy
Strong sellStrong buy
Strong sellSellNeutralBuyStrong buy
Summary
Neutral
SellBuy
Strong sellStrong buy
Strong sellSellNeutralBuyStrong buy
Summary
Neutral
SellBuy
Strong sellStrong buy
Strong sellSellNeutralBuyStrong buy
Moving Averages
Neutral
SellBuy
Strong sellStrong buy
Strong sellSellNeutralBuyStrong buy
Moving Averages
Neutral
SellBuy
Strong sellStrong buy
Strong sellSellNeutralBuyStrong buy
Displays a symbol's price movements over previous years to identify recurring trends.
Frequently Asked Questions
The current price of XLM / USDT Spot Trading Pair (XLM) is 0.4678 USDT — it has risen 0.53% in the past 24 hours. Try placing this info into the context by checking out what coins are also gaining and losing at the moment and seeing XLM price chart.
XLM / USDT Spot Trading Pair price has risen by 74.92% over the last week, its month performance shows a 75.53% increase, and as for the last year, XLM / USDT Spot Trading Pair has increased by 345.90%. See more dynamics on XLM price chart.
Keep track of coins' changes with our Crypto Coins Heatmap.
Keep track of coins' changes with our Crypto Coins Heatmap.
XLM / USDT Spot Trading Pair (XLM) reached its highest price on Nov 24, 2024 — it amounted to 0.6336 USDT. Find more insights on the XLM price chart.
See the list of crypto gainers and choose what best fits your strategy.
See the list of crypto gainers and choose what best fits your strategy.
XLM / USDT Spot Trading Pair (XLM) reached the lowest price of 0.0703 USDT on Dec 29, 2022. View more XLM / USDT Spot Trading Pair dynamics on the price chart.
See the list of crypto losers to find unexpected opportunities.
See the list of crypto losers to find unexpected opportunities.
The safest choice when buying XLM is to go to a well-known crypto exchange. Some of the popular names are Binance, Coinbase, Kraken. But you'll have to find a reliable broker and create an account first. You can trade XLM right from TradingView charts — just choose a broker and connect to your account.
Crypto markets are famous for their volatility, so one should study all the available stats before adding crypto assets to their portfolio. Very often it's technical analysis that comes in handy. We prepared technical ratings for XLM / USDT Spot Trading Pair (XLM): today its technical analysis shows the buy signal, and according to the 1 week rating XLM shows the buy signal. And you'd better dig deeper and study 1 month rating too — it's strong buy. Find inspiration in XLM / USDT Spot Trading Pair trading ideas and keep track of what's moving crypto markets with our crypto news feed.
XLM / USDT Spot Trading Pair (XLM) is just as reliable as any other crypto asset — this corner of the world market is highly volatile. Today, for instance, XLM / USDT Spot Trading Pair is estimated as 5.88% volatile. The only thing it means is that you must prepare and examine all available information before making a decision. And if you're not sure about XLM / USDT Spot Trading Pair, you can find more inspiration in our curated watchlists.
You can discuss XLM / USDT Spot Trading Pair (XLM) with other users in our public chats, Minds or in the comments to Ideas.