XLM Explodes +132% — Is the Party Over or Just Starting?XLM has been one of the top movers, sweeping the January 2025 swing high at $0.515 before stalling and moving sideways for the past 4 days.
Is XLM gearing up for another push toward the highs, or is a correction imminent?
Let’s dive into the details.
🧩 Market Structure & Fractal Pattern
XLM skyrocketed +132% in just 13 days, mirroring the explosive move seen back in November 2024.
If we apply the November fractal, the current price action suggests we could be setting up for an ABC corrective move.
📉 Key Levels & Confluences
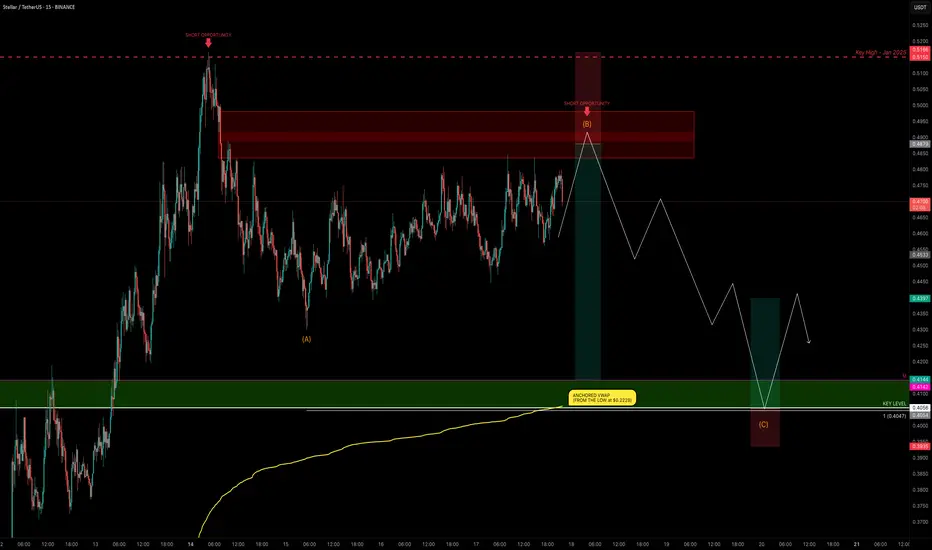
FVG Zone: ~$0.49–$0.50 — likely to be swept before any major move down.
Monthly Support: $0.4142
Key Level / Liquidity Pool: $0.4056 — likely cluster of stop-losses.
Anchored VWAP (from $0.2228 start of trend): currently near $0.4056, adding strong confluence.
1.0 Trend-Based Fib Extension (ABC projection): If price pushes to ~$0.49 to complete wave B, the projected 1.0 TBFE for wave C lands right on the $0.4056 key level + VWAP, creating a perfect confluence zone.
➡️ Conclusion: The $0.4142–$0.4056 zone is a critical support and liquidity area with multiple confluences lining up.
Trade Setups
🔴 Short Setup:
Entry zone: $0.48–$0.50 (ladder in)
Stop-loss: Above $0.5166 (prior high)
Take-profit: $0.4142–$0.4056 zone
R:R ≈ 1:3
🟢 Long Setup:
Entry zone: $0.4142–$0.4056 (preferably near VWAP)
Stop-loss: Below $0.395
Take-profit: $0.44
⚡ Final Thoughts
Watch for a potential final push toward $0.49–$0.50 before a corrective wave unfolds.
The confluence at the $0.4142–$0.4056 zone — including monthly/weekly levels, VWAP, liquidity pool, and the 1.0 TBFE target — makes it a key area for decision-making.
Stay patient and wait for confirmation at these levels. Will post an update as things unfold!
_________________________________
💬 If you found this helpful, drop a like and comment!
Want breakdowns of other charts? Leave your requests below.
XLMUSDT trade ideas
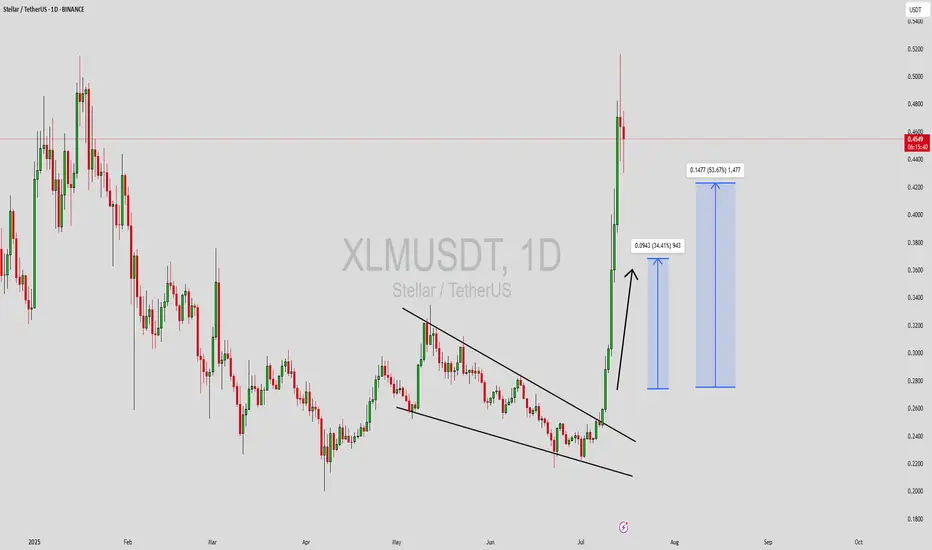
XLMUSDT Forming Falling WedgeXLMUSDT (Stellar) has recently delivered an impressive breakout from a prolonged downtrend, indicating strong bullish momentum following the completion of a falling wedge pattern. This pattern, known for its high probability of signaling a bullish reversal, was confirmed as price exploded upward with increasing volume — a textbook breakout scenario. After a period of consolidation, Stellar surged sharply, catching the attention of both technical analysts and long-term investors.
Volume is playing a key role in this rally. The sharp rise in buying pressure is a strong sign that institutional and retail investors are accumulating XLM, possibly in anticipation of a sustained move. The breakout zone now acts as a major support area, and we may see price revisit this level briefly before resuming its next upward leg. If the bullish sentiment continues, we can expect gains in the range of 40% to 50%+ from current levels, with strong momentum and follow-through likely in the short term.
The broader sentiment around Stellar has been improving as well, with increased interest in its blockchain utility, particularly in the cross-border payments space. As investor confidence builds and momentum traders join in, the probability of another leg higher strengthens. Technical setups like this, combined with solid fundamentals and growing on-chain adoption, provide compelling opportunities in a recovering market.
✅ Show your support by hitting the like button and
✅ Leaving a comment below! (What is You opinion about this Coin)
Your feedback and engagement keep me inspired to share more insightful market analysis with you!
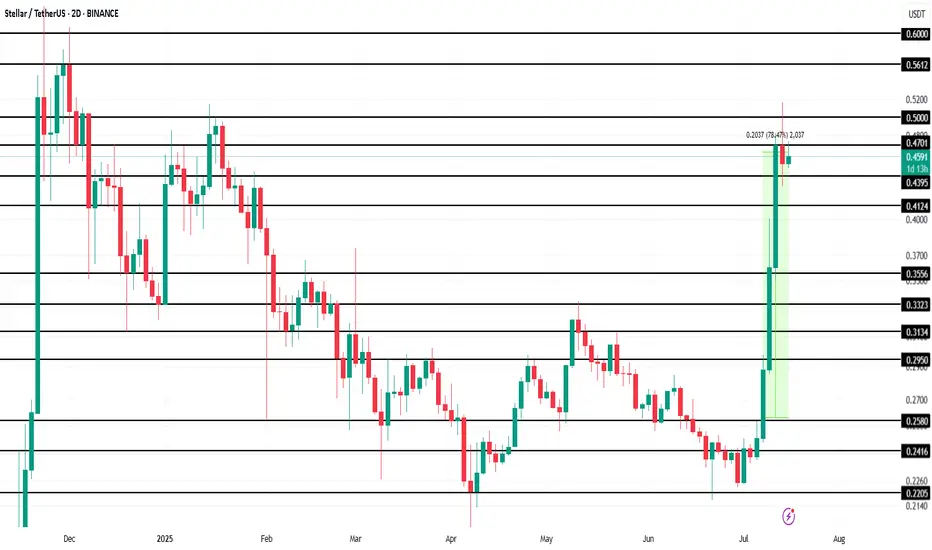
Stellar (XLM) Rejected Hard—Brace for $0.25 Next?On the daily chart of XLM/USDT, price has made a steep, parabolic rise, pushing directly into a well-established resistance zone around $0.5155. This level has historically capped price moves, evident from several prior swing highs clustering near this area. The rally itself unfolded rapidly, without significant consolidation, leaving a series of untested supports in its wake.
This combination—a near-vertical climb into resistance—often signals buyer exhaustion. Indeed, the rejection candle formed right at the $0.5155 ceiling, which strengthens the bearish argument.
Below the current price action, there is a broad support zone between $0.3347 and $0.3504. This area previously acted as resistance earlier in the year and is likely to attract some buying interest if price pulls back decisively. Beneath it lie deeper supports around $0.2500, $0.2268, and $0.2000—levels that remain untested during this move up.
While the chart does not display volume bars, the sheer steepness of the final leg suggests momentum was likely unsustainable. Often, such aggressive spikes without healthy consolidation result in a retracement of 30–50% or more.
One critical factor to watch is whether price manages to reclaim and hold above $0.5155. Failure to do so implies that sellers remain in control, raising the probability of a broader pullback toward the mid-$0.30s or lower.
________________________________________
📉 Why This Setup Leans Bearish
This chart structure supports a bearish thesis because:
• Price is reacting strongly to historical resistance.
• The rally was parabolic, making it prone to sharp corrections.
• There is no clear consolidation base above the breakout point.
• Several untested support levels remain below current price, which the market may revisit.
If this move is indeed an exhaustion spike, the next phase is typically a retest of the last major consolidation area around $0.3504–$0.3347.
________________________________________
📊 Potential Bearish Trading Setup
Here is a structured trading idea to consider:
Short Entry Zone:
• Retest of the $0.5155–$0.5200 resistance area.
• Look for confirmation by way of bearish candlestick patterns (shooting star, bearish engulfing, or consecutive rejection wicks).
Stop Loss:
• Conservative stop above $0.6374 to allow for volatility.
• Alternatively, a tighter stop just above $0.5200 if using smaller size.
Targets:
• First target: $0.3504 (major support).
• Second target: $0.2500.
• Third target: $0.2000–$0.2268 (deeper retracement zone).

Stellar Price Set to Rise: $0.95, $1.35, $1.80 AheadHello✌
Let’s analyze Stellar’s upcoming price potential 📈.
BINANCE:XLMUSDT , I expect a long-term upward bullish trend.
There are three main targets in this analysis: $0.95, $1.35, and a final target of $1.80, which could be reached within 2 to 6 years.
The price may form parallel channels at times, which are shown on the chart. We can also see an important trendline supporting the movement.
✨We put love into every post!
Your support inspires us 💛 Drop a comment we’d love to hear from you! Thanks , Mad Whale🐋
🐋Many of the points and levels shown on the chart are based on personal experience, feeling, and over 7 years of research and daily study of crypto charts.
Some of the lines, channels, and price zones are drawn to make the chart easier to understand and to help imagine possible future price movements.
I’ve also included one very big drop in price even bigger than the others because in the crypto market, it’s common for prices to suddenly fall hard and push out small investors and traders with positions.
The targets on the chart are not guaranteed; they might be reached, or they might not.📚
📜Please make sure to do your own research before investing, and review the disclaimer provided at the end of each post.

Stellar Eyes 14% Upside, Targeting 0.30$Hello✌
All previous targets were nailed ✅! Now, let’s dive into a full analysis of the upcoming price potential for Stellar 📈.
BINANCE:XLMUSDT has convincingly broken above its daily descending channel resistance 📈 and is holding near a strong support level. This setup suggests a potential upside of at least 14%, aiming for a target price of $0.30 🚀.
✨ Need a little love!
We pour love into every post your support keeps us inspired! 💛 Don’t be shy, we’d love to hear from you on comments. Big thanks , Mad Whale 🐋

Is Stellar ready to rally 26% toward 0.55 target?Hello✌
let’s dive into a full analysis of the upcoming price potential for Stellar 📈.
BINANCE:XLMUSDT has surged through multiple daily resistance levels this past week, resembling a powerful breakout 🚀. It is now approaching a key daily support that aligns with the 0.26 Fibonacci retracement level. If this support holds, there is potential for a 26% gain, with a target price of 0.55 📈.
✨ Need a little love!
We pour love into every post your support keeps us inspired! 💛 Don’t be shy, we’d love to hear from you on comments. Big thanks , Mad Whale 🐋

Stellar (XLM) Makes History Amid 78% Price Surge This WeekBINANCE:XLMUSDT is currently trading at $0.46, up 78.5% over the past week . However, the altcoin faces resistance at $0.47, a level it has struggled to breach in recent days. The ability to break this resistance is crucial for continued growth, as it will determine whether XLM can push higher.
BINANCE:XLMUSDT futures market activity has also surged, with Futures Open Interest hitting an all-time high of $520 million in the last 24 hours. This indicates that traders are increasingly interested in the asset's derivatives, which are capitalizing on its rise.
Given the strong sentiment from futures traders and the technical indicators, it is likely that BINANCE:XLMUSDT will push past the $0.47 resistance and target $0.50 in the coming days . A successful breakthrough could lead XLM toward its next target at $0.56, marking an eight-month high. This would signify continued strength for the asset.
However, if the broader market sentiment shifts or investors begin to sell their holdings, BINANCE:XLMUSDT could face a significant pullback. If the price falls below the key support levels of $0.43 and $0.41 , it could slide further to $0.35, which would invalidate the current bullish outlook.
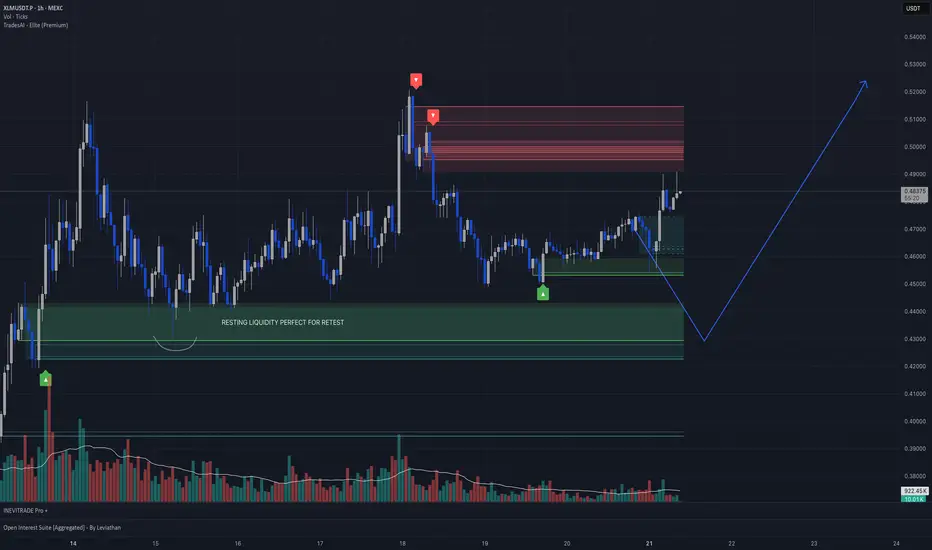
XLM/USDT 1-hour chart analysisHey everyone! Thrilled to present my first TradingView idea! Check out this XLM/USDT 1-hour chart from MEXC. I’ve identified a key “resting liquidity” zone at 0.4100–0.4200, where I expect a retest soon. The price surged from 0.4000 to 0.5200, hit resistance, and is now consolidating around 0.47388. This green zone was a consolidation area before the breakout, and with high volume at the peak dropping during the pullback, it’s a prime dip zone. If it holds, we could see a move back to 0.5200!
XLM/USDT;FREE SIGNALHello friends🙌
Given the good price growth, you can see that the price has entered a channel, which has caused the price to form a flag...
Now, with a strong channel breakdown by buyers and their entry, you can enter the trade with risk and capital management and move with it to the specified targets.
🔥Join us for more signals🔥
*Trade safely with us*

XLM - Stellar - Possible Short coming up - This is Why?Reading the chart (annotations in sync with chart):
1. Location: Fib over-shoot - possible sellers
2. Largest up volume - possible sellers in there
3. Mountain shape PVR - increasing volume as wave progress
4. Abnormal SIs at top (could be closing positions but it also could be sellers absorbing buy orders.
Risky Entry but with better RR enter now. stop above tops, target blue AVWAP
Conservative Entry with worse RR: wait for the break downwards of red AVWAP, target blue AVWAP.
Enjoy, wave and speed index reading!

Stellar XLM price analysisToday, the price of CRYPTOCAP:XLM rose quite dramatically, doing so at a critically important moment, but trading volumes are slightly insufficient for final confirmation.
Now let's look at what we wrote for the OKX:XLMUSDT chart four months ago: “It would be ‘right’ to test $0.19-0.20 before the start of strong growth.”
👆
The minimum was $0.19976 — do we "check" and "done" that?
📈 If so, then the price of #XLM should not fall below $0.226 anymore.
And ahead lies only growth in the price of the #Stellar token to at least $0.50, or even $0.60.
🏆 Well, and about the global goal for #XLMUSD we wrote in the previous idea — read, analyze, and turn information into profit!
_____________________
Did you like our analysis? Leave a comment, like, and follow to get more

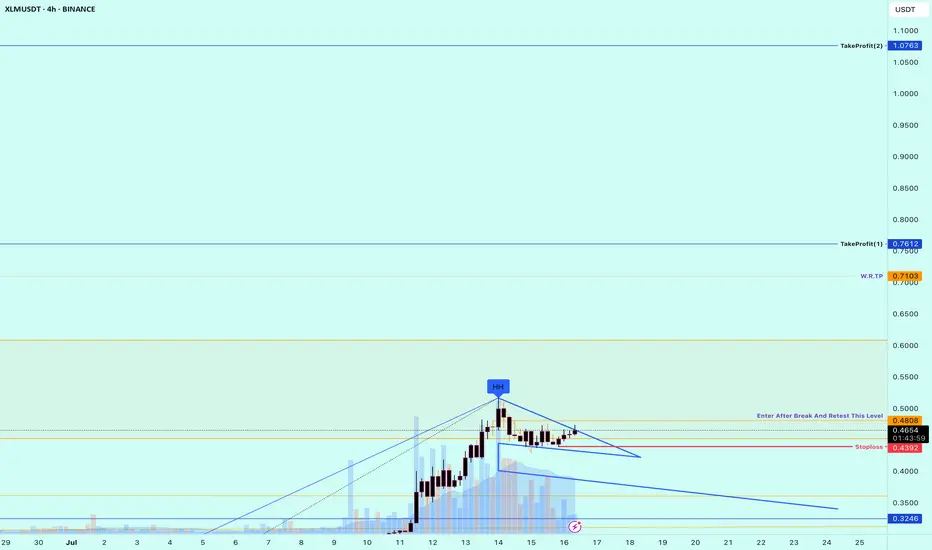
Stellar (XLM): Looking For Breakout | Breakout + Re-TestStellar is going to a breakout, a breakout which will give us a good opportunity for a long position. Now, we might see some smaller rejection and correction from current area, but we still will be witing for breakout, not going to enter earlier into trade here.
Better safe then sorry yea?
Swallow Academy

$XLM/USDT Breakout Alert: 80% Move on the Table?CRYPTOCAP:XLM just broke out of its downtrend after months of being stuck in a falling channel.
The breakout came with a strong 12% pump, and price is now holding above both the trendline and the 40MA, a solid bullish sign.
If this move holds, we could see XLM push toward the $0.4540 zone (that’s nearly 80% up).
A quick retest around $0.2646 might be the next best entry.

From Resistance to Support: XLM Sets the StageXLM had been consolidating under a descending trendline since early 2025. But today, we saw a strong breakout backed by solid momentum.
What’s even better?
It flipped a key resistance zone into support — classic breakout, retest setup.
If bulls hold this level, the next leg up could be explosive.
DYOR, NFA

Buy Trade Strategy for XLM: Powering Fast and Inclusive PaymentsDescription:
This trading idea highlights XLM (Stellar Lumens), the native asset of the Stellar network — a blockchain platform built to enable fast, low-cost, and borderless financial transactions. XLM is designed to facilitate cross-border payments and connect financial institutions, payment systems, and individuals, especially in underbanked regions. Backed by the Stellar Development Foundation and partnerships with major global players such as MoneyGram, Stellar is focused on real-world use cases, making XLM a compelling project in the global payments and remittance sector.
With growing institutional interest and real-world utility, XLM stands out as a fundamental player in blockchain-based financial inclusion. However, despite its strong fundamentals, the cryptocurrency market is highly volatile. Factors such as global economic conditions, regulatory changes, and evolving technologies can significantly impact price action and project development.
Disclaimer:
This trading idea is for educational purposes only and does not represent financial advice. Trading cryptocurrencies like XLM involves substantial risk, including the potential for total loss of capital. You should always perform your own research, understand your risk tolerance, and consult a professional financial advisor before making any investment decisions. Past performance is not indicative of future results.
XLMUSDT.P – Fibonacci Buy Zone & Fair Value Gap Alignment (KT FuKT Digital Asset Hedge Fund Strategy Setup – 15m Chart
This idea shows a potential long opportunity using the KT Fund’s intraday Fibonacci trend entry system, which aligns confluence zones with strict SL/TP rules:

XLM wait for entryXLM tends to show strong volatility and often moves ahead of the broader market during BTC rallies.
We're monitoring for a retracement and a potential rebound from a significant support level.
Disclaimer:
This analysis is based on my personnal views and is not a financial advice. Risk is under your control.

XLM ,1DAs BTC is Falling And BTC is given Breakout of Pattern in 4Hr , then Remaining coins will also fall drastically .
in 1D pattern of XLMUSDT , it is Breaking Down as BTC is also given Break Down of Pattern
Follow for More Ideas like This

xlmusdt trading opportunityXLMUSDT has exhibited a breakout from a falling wedge formation, the price is anticipated to perpetuate its antecedent bullish trajectory.
We have demarcated a specific zone on the chart that we refer to as the 'bull important zone.' This region is earmarked for its potential as an accumulation zone. The rationale behind selecting this area is grounded in its historical significance where the price has found robust support, thus offering an attractive risk-reward ratio for long entries.
Risk management protocols dictate that a stop loss be judiciously placed below the recent all-time low (ATL) at approximately $0.0703 to safeguard against unforeseen bearish reversals and to preserve capital.
The proximate objective for this trading setup is delineated as the 'immediate setup target' on our chart.
We greatly value your active participation and feedback on our analysis. Your likes are the motivation that sustains our commitment to providing insightful market analysis.
Thank you for your engagement and support.

Phemex Analysis #95: Pro Tips for Trading Stellar (XLM)Stellar ( PHEMEX:XLMUSDT.P ) is an open-source, decentralized blockchain platform specializing in fast, affordable cross-border transactions aimed at enhancing global financial inclusion. Its native cryptocurrency, Lumens (XLM), serves as a bridge for currency exchanges and is used to pay transaction fees on the network. Founded in 2014 by Jed McCaleb, Stellar connects banks, payment systems, and individuals worldwide, providing seamless and cost-effective financial interactions.
Recently, Stellar has shown positive market momentum, including a notable 5% price surge coupled with increased transaction volumes. A key catalyst for this optimism is PayPal’s upcoming integration of its stablecoin PYUSD onto the Stellar blockchain, significantly expanding Stellar's real-world use case and accessibility across more than 170 countries.
Given these promising developments, let’s explore several possible trading scenarios to help traders strategically approach XLM.
Possible Scenarios
1. Breakout Rise to $0.28 and Above (Bullish Scenario)
On the daily chart, XLM recently formed a clear "cup and handle" pattern, with the handle emerging around June 22. This classic bullish indicator signals accumulation of buying momentum. If XLM decisively breaks out above the critical resistance level at $0.257, particularly with strong trading volume, it could confirm a bullish continuation, potentially targeting resistance zones around $0.28, $0.312, and even the significant resistance at $0.43.
Pro Tips:
Entry Point: Consider entering positions after confirming the breakout above $0.257, ideally with significant volume confirmation.
Profit-Taking Levels: Aim to take partial profits at key resistance levels: $0.28, $0.312, and $0.43.
2. Rejection by Key Resistance Levels (Neutral Scenario)
While the immediate resistance at $0.28 is relatively weak and likely to be overcome easily, subsequent resistance at $0.312 and particularly at $0.43 could present strong selling pressure, potentially rejecting XLM’s first attempt.
If rejection occurs, the price will likely retrace to retest support zones, such as around $0.25, consolidating before attempting another bullish move.
Pro Tips:
Cautious Entries: If initial rejections occur at higher resistance zones ($0.312 or $0.43), consider waiting for price stabilization around lower support areas ($0.25) before re-entering.
Volume Check: Closely monitor trading volumes during retracements—declining volume often indicates a healthy pullback rather than a significant reversal.
3. All Things Go South (Bearish Scenario)
If broader market sentiment suddenly turns sharply negative—particularly driven by a significant decline in Bitcoin—XLM could face substantial selling pressure. A sharp drop below key support at $0.216 with high volume, accompanied by broader market downturns, would signal serious bearish momentum.
Pro Tips:
Market Observation: Stay cautious and consider stepping aside until clear stabilization occurs at lower support levels.
Accumulation Opportunities: Long-term holders should watch closely for stabilization at critical historical supports, including $0.20, $0.18, $0.12, and $0.09, which could offer attractive entry points for gradual accumulation.
Conclusion
Stellar (XLM) currently stands at a pivotal juncture driven by significant fundamental catalysts and compelling technical signals. By closely monitoring the outlined bullish, neutral, and bearish scenarios, traders can strategically position themselves for profitable trades while effectively managing risks. Always remain alert, employ disciplined risk management strategies, and stay informed on broader market movements to successfully navigate XLM’s market dynamics.
🔥 Tips:
Armed Your Trading Arsenal with advanced tools like multiple watchlists, basket orders, and real-time strategy adjustments at Phemex. Our USDT-based scaled orders give you precise control over your risk, while iceberg orders provide stealthy execution.
Disclaimer: This is NOT financial or investment advice. Please conduct your own research (DYOR). Phemex is not responsible, directly or indirectly, for any damage or loss incurred or claimed to be caused by or in association with the use of or reliance on any content, goods, or services mentioned in this article.

Stellar 2025 Bull Market, ATH Targets, Price Action & MoreA very interesting chart. What is interesting here is how obvious it is that the correction is over. Stellar produced a massive bullish breakout in November 2024, more than 700% growth. After a strong move, there is always a correction. After the correction ends, we get the resumption of the initial move, in this case a bullish wave.
The 0.786 Fib. retracement level worked as support. 7-April. There is an interesting dynamic around this level. Back in July 2023 as XLMUSDT was rising resistance was found around 0.2000. Very close to this level. We then had the late 2024 bullish wave and the correction that ended in early April this year. Support was found exactly at the 0.786 Fib retracement level and this level matches 0.2000. This is the purple line on the chart. Resistance turned support.
After this support zone was hit and confirmed Stellar moved to produce an initial breakout and on the 16-June week, 22-June, we get a higher low. This higher low signals the start of the next bullish wave with a target around 0.9100. This is the next target for the current move but not necessarily where the bull market cycle will end. Can be but not necessarily, the action can move higher.
Growth potential from current price to our target goes to 257%. Coming from the August 2024 low, this same target would give a total of 1,099%. Seeing how strong the first jump was, it is likely that Stellar will go higher in this 2025 bull market.
We have another target between $1.25 and $1.35.
Let's focus on the market and the bigger picture.
Stellar has already proven that it will be a top performer in this cycle. Back in late 2024 XLM outperformed many projects, we can expect the same pattern to repeat in this bullish continuation.
The fact that there are no new lows also signals strength. We saw many pairs hitting new all-time lows in April and June, this is not the case here. And this is also good.
This is a proven project so it is easy to go in big.
Last time the meat of the move unraveled in just two weeks. Something also to keep in mind. Something similar would allow us to profit from the entire XLM wave and then browse the market for new opportunities.
Remember, the market is set to grow for 6 months in the least or it can extend and grow for years. While some pairs go down, others will be going up. When some pairs stop going up, others being down will recover and grow. The market will cycle between this and that, here and there; in the end, everything grows; that's the definition of a bull market. A rising wave lifts all boats.
Notice the long-term consolidation phase, it lasted more than 900 days and then we had a very strong bullish breakout. The longer the consolidation phase, the stronger the move that follows. This is only the beginning, there will be more.
Thank you for reading and for your continued support.
Namaste.

Stellar (XLM) Price Analysis - Potential Breakout ScenarioThis chart provides a technical analysis of Stellar (XLM) against Tether (USDT) on a daily timeframe, highlighting a potential breakout scenario. The price has been trending downward, approaching a key support area. The green arrow indicates a possible upward movement if a confirmed low is established below the highlighted zone. Key levels to watch include the support at around 0.2396 and the resistance trendline. Analysis conducted on TradingView as of July 06, 2025, 10:33 AM BST.

XLM Stellar Long Closed on 2nd ResistanceBased on previous entry explanation posts
Trade was closed with nice profit on second resistance which happen to touch it right on US non Farm news.
Enjoy!
