XLMUSDT LONG scalpingXLMUSDT LONG
Entry : 0.0892 / 0.0893
Leverage : Cross X20
Stop loss : 3.5%
Targets : 0.0924255
Capital invested : 1%
XLMUSDT trade ideas

XLMUSDT Technical Chart ReviewWhen the daily chart of XLMUSDT is examined; It is observed that the price movements continue in a downward trend. As long as the crypto price does not break below the 0.08059 level, it is evaluated that in price movements above the 0.09406 level, it can cross the 0.11566 level and target the 0.14259 level.

XLM Technical Analysis in a 3-Day TimeframeHello everyone, I’m Cryptorphic.
I’ve been sharing insightful charts and analysis for the past seven years.
Follow me for:
~ Unbiased analyses on trending altcoins.
~ Identifying altcoins with 10x-50x potential.
~ Futures trade setups.
~ Daily updates on Bitcoin and Ethereum.
~ High time frame (HTF) market bottom and top calls.
~ Short-term market movements.
~ Charts supported by critical fundamentals.
Now, let’s dive into this chart analysis:
XLM is struggling to close above the 50 EMA resistance. The price has tested this EMA several times but has failed to break above it. With the current rejection, XLM is likely to drop to the $0.0840 support trendline.
The lower support at $0.0754 is crucial for XLM to hold. A close below this support will likely invalidate the chart.
Key level:
- Primary Support/Entry: $0.085.
- Lower Support/Accumulation: $0.0754.
- Target: $0.14.
- Invalidation: A close below the $0.0754 support.
DYOR. NFA.
Please hit the like button to support my content and share your thoughts in the comment section. Feel free to request any chart analysis you’d like to see!
Thank you!
#PEACE

XLM USDTXLM is in a bearish trend trading under the trend line for approximately 158 days. After rejection from the trend line and the resistance zone (Green) at $0.1009 - $0.1031 is moving towards the support level of $0.0917.
If the support level fails to hold the price it could move towards the next support zone (Pink) at $0.0822 - $0.0833.The last support zone (Yellow) is marked on the chart as a place where it could bounce back in the worst-case scenario.
According to our analysis, they could bounce back from the nearest support at $0.0917 and then we drop to the support zone in Pink. We could take entries at these levels.
For the bullish scenario, the price has to break above the trend line and the resistance zone in Green with high volume.
Traders should be vigilant, considering positions based on the support's reaction and entering a buy if it holds. Always consider risk management strategies, especially with the current market volatility, and set stop-loss orders to protect against unforeseen price movements.

The previous downtrend has not yet fully reversedThe XLM price has reached a significant support level and is gradually attempting to recover. This support zone acts as a key point for price stabilization, but the previous downtrend has not yet fully reversed.
Support and Resistance Levels:
Support Levels:
$0.0987 USDT: This level serves as the primary support, with the price attempting to rebound near this level.
$0.0950 USDT: This lower support level may act as a backup if the $0.0987 level is broken.
Resistance Levels:
$0.1012 USDT: This is the first resistance level that the price must break through to confirm a trend reversal.
$0.1030 USDT: Breaking this next resistance level could signal the return of buyer strength and the potential start of a new upward trend.
The XLM/USDT chart shows that the price has reached a significant support area and is trying to rebound. Breaking through the $0.1012 and $0.1030 resistance levels could confirm a trend reversal and the beginning of an upward movement. However, if the price fails to break these levels, the downtrend may continue.

Long Position on XLMUSDT / Volume ProjectionBINANCE:XLMUSDT
COINBASE:XLMUSD
SL2 ---> Mid-risk status: 5x-8x Leverage
SL1 ---> Low-risk status: 3x-4x Leverage
👾The setup is active but expect the uncertain phase as well.
⚡️TP:
0.1045
0.1055
0.1070
0.1085
0.1100
0.01112(In Optimistic Scenario)
➡️SL:
0.0977
0.0955
🧐 The Alternate scenario:
🔴If the price stabilizes below the trigger zone, the setup will be cancelled.

XLMUSDTHM Triangle BO v1.0 spotted. Looking good with previous wave up with increasing volume and momentum.
- BOS (Breaks of Structure) at @ 0.09849 - 0.10024 level
- Trending slow and steady if able to hold above the BOS level
It is at extremely good reward to risk level if able to break the upper trendline.

XLM VS XRPAt the time of sharing this post XLM is up by 7% and XRP is up by 23%. Yet again XLM is proving that it only exists to be XRP’s bitch and nothing more.

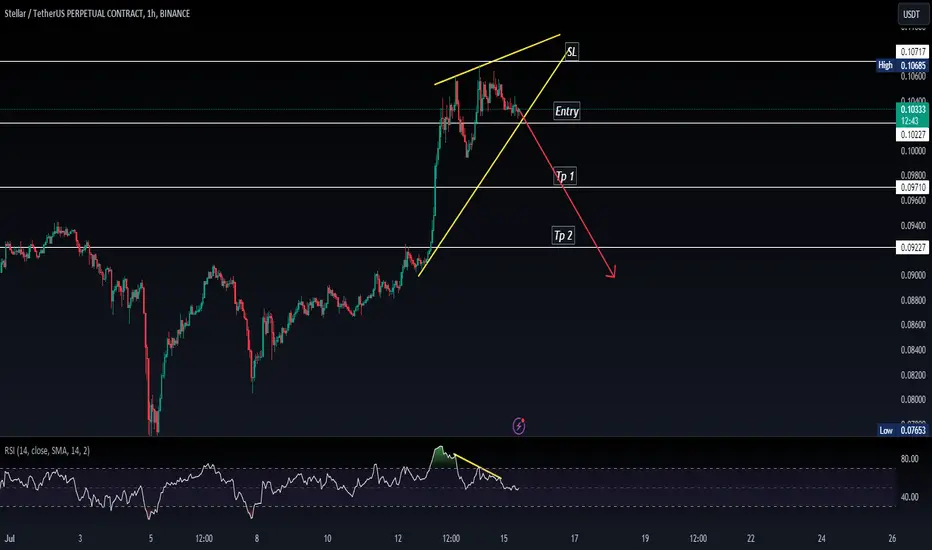
XLMUSDTWe can attempt to short XLMUSDT from specified level if it break HL , also bearish divergence occur indicate that it moves downward.
SL , TP mention in chart.

XLMUSDT SellStellar sell signal on H4 chart. We see consolidation between 0.1010 - 0.1075 level. Now bears are ready to retest bulls power at 0.097 level. Risk Reward 1:2.5

XLMUSDT KEY LEVELSExplanation:
This is a very useful trading system. This means that you should not take a trade blindly, but rather that there is another confirmation to take the trade you can use this for perfect entry and perfect exit
This trading opportunity is based on volume, previous price, and price range , are included
Entry/Exit point's:
- It has very easy entry and exit points
- In this pair of lines with two colors are given (RED AND GREEN)
- In this the GREEN line is used to take long entry and the RED line is used to take short entry (But it is all based on a more conformation from your trading plan)
Stop Loss/Take Profit:
Stop Loss
- According to this, if you take a long trade, its stop loss will be the RED line just below ( A trade can exit either when the price crosses the RED line or the 5 minute candlestick crosses the RED line. (This can be done according to your preference) )
- A short entry should use the opposite rules to a long entry
Take Profit
-When you take a long entry according to the profit to be booked is on the next RED line above. ( Or if there are other reasons, it can be a safe exit )
- Opposite rules for booking profit on long entry are to book profit on short trade. ( The GREEN line above is the stop loss of short entry )
Timeframe:
According to this, the time frame you should use while taking trades is 5 minutes time frames . (5 minute time frame works well in this)
Risk Disclaimer:
Leave a comment if you like my entry setup. This share is for educational learning purposes only, and I am not responsible for your profit or loss. Note: For more details, check the chart.

XLMUSDT: Get Ready for Potential Big Moves! Yello, Paradisers! Are you ready for some potential big moves with #XLMUSDT? Let's dive into the analysis to see what's brewing!
💎#XLM is currently showing signs of a probable bullish continuation from a support zone at $0.0934. We've observed #XLM following a descending channel for quite some time. Recently, after breaking above the descending resistance, it's gaining momentum at this key support level.
💎 If the price holds strong at this level, there's a high probability of a bullish rally, similar to previous trends. A breakout above the probable resistance at $0.1117 could lead to targeting the next resistance zones and beyond. However, if the momentum doesn't hold at the key support, we might see a bullish rebound from the lower demand area around $0.0801.
💎 It's crucial to stay vigilant and monitor #XLM price movements closely. A daily closure below the demand area could invalidate the bullish outlook and potentially lead to further declines.
Remember, Paradisers, staying disciplined and patient is key in these volatile markets. Consistently profitable trading comes from waiting for the best opportunities. Stay focused and avoid emotional decisions!
MyCryptoParadise
iFeel the success🌴

Ripple “protégé” - Stellar is also trying to rise in XLM priceWhile encouraging news is starting to circulate around #Ripple and the price of OKX:XRPUSDT is slowly getting off its knees, by the way, a month ago we came up with an idea for CRYPTOCAP:XRP 👇
The #Ripple “protégé” #Stellar is also trying to rise in price a bit.
For two years, the OKX:XLMUSDT price probably formed a Double Bottom pattern. And for the next 1.5 years, the #XLMUSD price will be able to work out the goals of the pattern:
1️⃣ target - the base of the Double Bottom - $0.195
2️⃣ target - growth in the region of $0.64-0.65 for CRYPTOCAP:XLM by the end of 2025.
But under the current conditions, we do not believe that CRYPTOCAP:XRP can cost $10, and CRYPTOCAP:XLM more than a dollar. Unless they arrange denomination in projects 10-100 times or something?)


HopiumI’m gonna trade XLM purely based on this piece of Hopium. Sell target is 40-45 cents. After that XLM will go back to 20-25 cents. These are pure speculation and guesswork. This is not an analysis.

XLM is comingXLM is a project i despise but, it's chart is beautiful in all timeframes below 1W <3
Retesting a daily golden cross with bulish indicators
4H TF is at good support in the indicators
15min is screaming breakout

Nice XLM chart.I think that even though Lumens is quite an old asset, it will show itself again.
I am starting to work more often with MOTT and I am also starting to experiment with Linear Regression Oscillator .
We can see that the reversal signal has been received.
The price is confidently contracting above the invalidation level.
Let's pay attention to the range between 0.44 and 0.62 The most probable point of movement is somewhere between these two values. I mean ~0.50 average. Of course, the alt season could drive the price much higher, but a reasonable optimum lies between the two levels.
Think with your head always.

XLMUSDT.PXLMUSDT.P is in bullish trend.
Bearish divergence also shown in RSI.
Bearish rising edge reversal pattern also form .
WE wait and watch for the breakout of wedge pattern
Everyone is waiting for XRP, but XLM will flyThe Coinbase exchange has filed documents with the CFTC to list US-regulated futures.
On the chart we see that wave 2 may be completed after 1 diagonal. We are waiting for a big 3rd wave of growth to 0.45-0.5$ and a second target of 1.2$

Axis of ResistanceXLM must be able to break through all these resistance levels for a reversal. based on price action xlm has rejected every single resistance level and has failed to find support. alts bottom out after btc, the bottom for this bearish move is not in. price action says xlm will reject the next resistance level and will not find support leading t a lower low back to 7 cents. i think youll have a very good discount at 7 cents. even if we jump with green candles here, do not fomo, you will have your discount at 7 cents

Learn Somethingusually when price breaks above a trendline, a successful retest is a pull back to the trendline and a violent buying pressure. we will assume that my trendline is correct. if xlm is really in a bull market, then upon breaking out of the triangle and a pullback to the trendline it had to print multiple green candles and hold support above the trendline. what we see here is price keeps coming back to retest the trendline. the more this happens the less credible the support and retest will be. if price keeps coming back to the trendline without any buying pressure then it means price wants to go back into the descending triangle, which is the recipe for disaster if it does happen. all one can hope and pray for is for the price to hold above the trendline and print a big thick green candle, otherwise darker days are ahead.

Descending TriangleSupport and Resistance trend lines are shown. we will go to support before breaking out of the triangle to the upside. buy area = $0.07

ALT SEASONthis is alt season in reverse. the scammers on trading view have been selling you alt season for a few years now but when price goes below every single support level in its path and cannot break above any resistance level, the only direction is down to hell and also im sorry for saying this, but most people relying on scammers for trading data deserve that hell.
