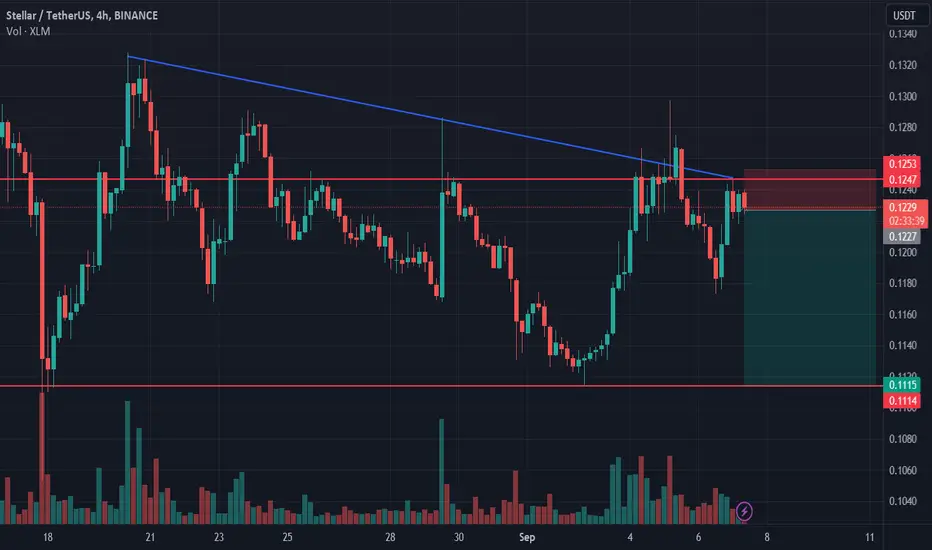
Stellar shortStellar bounced off the resistance level. Asset bounced down off the bearish trendline. Decline to support level at 0.1115 is expected to happen.
XLMUSDT trade ideas
XLM/USDT 1DAY UPDATE BY CRYPTO SANDERS !!hello, welcome to this XLM/USDT update by CRYPTO SANDERS.
CHART ANALYSIS:- XLM was one of the biggest movers, as the cryptocurrency rose by as much as 7% in today’s session.
After trading at a low of 0.1147 on Sunday, XLM/USD moved to an intraday peak of 0.126 earlier in the day.
This surge sees a stellar climb higher for a second consecutive day, following a rebound from a floor of 0.110.
Earlier gains have already begun to ease, which comes due to the relative strength index (RSI) colliding with a ceiling of 49.00.
the index is now tracking at 49.48, with the next point of resistance around 54.00.
Overall, bulls seem to have set their sights on the 0.135 level.
I have tried to bring the best possible outcome to this chart.
Hit the like button if you like it and share your charts in the comments section.
Thank you

xlm target8% up from here until next resistance it has strength to the upside so until it losses trend..

#TOBTC #LQR #XLMThese levels are important forStellar in short term
always DYOR and keep you'r money manangment

🚨 Trade Update: XLM/USDT (3-5x)🚨 Trade Update: XLM/USDT (3-5x)
📈 Long Entry: 0.1130 - 0.1218
OTE (Optimal Trade Entry): 0.1180
SL: 0.1100
B/E Move: When it moves close to TP2
TPs:
Short Term: 0.1230 - 0.1250 - 0.1270 - 0.1300 - 0.1350 - 0.1400
Mid Term: 0.1450 - 0.1500 - 0.1550 - 0.1600 - 0.1700 - 0.1800
**Disclaimer: Past profits do not guarantee future results.
Is there a risk? Of course. The whole financial market is subject to risk; any fundamental reason or sudden change in the market sentiment can reverse the current market dynamic and cause a loss. Do not take excessive risks which you cannot afford to lose. There is no obligation to take this trade; please avoid the trade if you disagree with the trade analysis.
EDK FORUM TRADING®

XLMUSDT long/SHORT ... JUST AN IDEAhope the chart stated the agenda n priority...
Did a Huge pump n retraced nicely
Lets Go up n Njoy profits...
NAFA n DYOR
Thank You

XLMUSDT 8H#XLM broken the Falling wedge pattern on 8H chart. Expecting a retest and then continue upside movement. Targets are on chart.

xlm getting ready for massive bullish rally seems like correction is over and xlm looks ready for decent recovery
falling wedge breakout has already confirmed in h4 timeframe expecting 45 to 50% bullish rally
expecting move towards 0.17$

XLM BEARISH 1DIn the 1D period, my prediction is that BINANCE:XLMUSDT will go down to $0.10, then its first target will be $0.14.
I wish you a lot of luck!

XLMUSDTXLMUSDT was trading under declining trendline and recently bulls took the charge and has given the breakout from declining trendline. Currently the price is retracing and creating the support around 0.1180region.
Will the bulls take charge again continue for leg higher ?

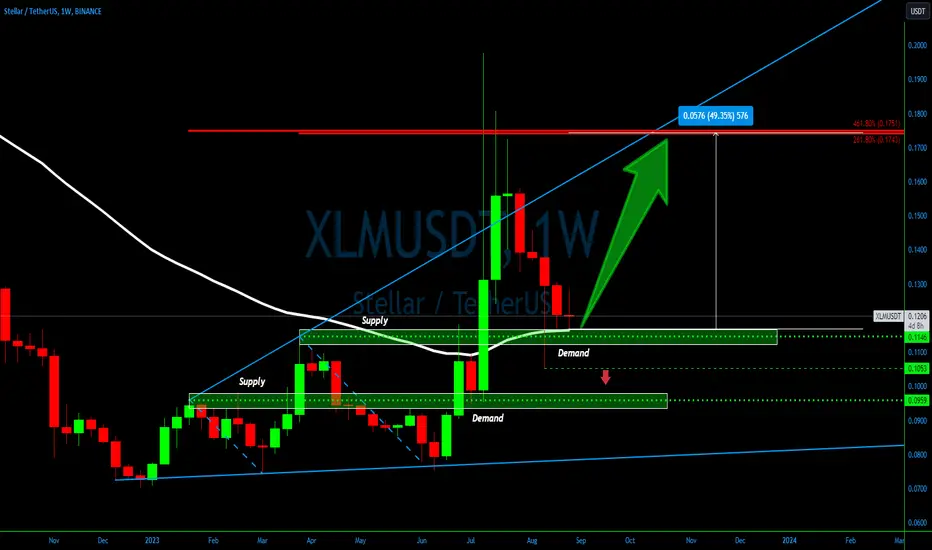
Unpacking XLMUSDT Price Patterns💎 Diving into #Stellar's long-term price trajectory, we spot some captivating patterns. The weekly #XLMUSDT chart reveals the price nestled in a robust demand zone, a magnet for buyers. Moreover, the 200 Exponential Moving Average has been consistently rebuffed in the past weeks.
💎 The bullish uptrend is evident with the formation of LLs and LHs. Given #XLM's position at support, it hints at a promising risk-reward scenario for bullish traders. As long as the price hovers above the current demand zone and crucially, remains north of the recent low at $0.1053, the scales tip towards an uptrend continuation.
💎 Eyeing the upside, a formidable resistance looms at $0.1750, marking a 50% surge from the present rate. This resistance's potency is amplified by a dual Fibonacci level, specifically at 261.8% and 461.8%. We could witness either a swift rally or an extended consolidation before #XLMUSDT ascends. In this volatile dance, patience and discipline remain our steadfast partners.
XLMUSD ❕ descending wedgeTD Sequential formed an upward reversal signal (1H and 30m TFs)
I believe that the asset will rebound after holding the support level.

XLM going to 0This thing has absolutely no momentum whatsoever.
Sell every pump if you are a bull, short every pump peak if you are a bear.
That's how it works with this one. Been like that for more than 5 years.
Going to 0$
NFA, DYOR

XLM | It About That Time | LONGStellar (XLM) is a peer-to-peer (P2P) decentralized network created in 2014 by The Stellar Development Foundation or Stellar.org. The network officially launched in 2015 with the purpose of connecting the world's financial systems and ensuring a protocol for payment providers and financial institutions. The platform is designed to move financial resources swiftly and reliably at minimal cost. Stellar links people, banks, payment processors and allows users to create, send and trade multiple types of crypto.

XLM mega bullishYou yourself can see everything. Ripple's brother is mega bullish. Just some gasoline needed. No comment

XLM Sell TradeHere is My Study On XLM.
Welcome to my channel! Here you'll find daily technical analysis ofthe latest trends in the crypto market. From Bitcoin to altcoins, I'lIl be sharing my insights and predictions to help you make informed decisions
about your investments. Follow me for the latest updates and join the conversation in the comments!
Crypto technical analysis uses past price history to predict future price. It's not a guarantee and shouldn't be relied on solely for investment decisions. Consider other factors such as market trends, economic strength and
information dissemination. Use with caution.
This Is Not A Finacial Advise

XLM/USDT Possible Breakdown? Hey brother and sisters 👋
Another one is XLM coin so let's get started! We are looking for potential breakdown on current zone after witnessing a massive recovery with a nice re-test! What do you think about this one guys?
If you like ideas provided by our team you can show us your support by liking and commenting.
Yours Sincerely,
Swallow Team
Disclamer:
We are not financial advisors. The content that we share on this website are for educational purposes and are our own personal opinions.

Stellar shortStellar bounced off the resistance level. Asset bounced off the descending trendline. Bearish movement to support level at 0.106 is possible.

XLM/USDT 1DAY UPDATE BY CRYPTO SANDERS !!hello, welcome to this XLM/USDT update by CRYPTO SANDERS.
CHART ANALYSIS:- Stellar (XLM) rose higher on Saturday, following a recent six-day losing streak which pushed the price to a multi-month low.
XLM/USD climbed to an intraday peak at 0.12 earlier in today’s session, which comes following a low of 0.1115 the day prior.
The move comes as Stellar continued to move away from a support point at 0.110, which was hit on Thursday.
This was the first time the price collided with this floor since mid-June and comes as the relative strength index (RSI) hit its own floor at 30.00.
the index has also rebounded and is now tracking at 34.84, which is marginally below a ceiling of 36.00.
Should it push past this point, the next likely price target will be around a ceiling of $0.1340.
I have tried to bring the best possible outcome to this chart.
Hit the like button if you like it and share your charts in the comments section.
Thank you

Bear Flag?I see a bearish flag structure forming on the hourly. I won’t confirm that it’s a bearish flag until I see it break down below the support trend line and close there.

XLM: Pullback in UptrendStellar (XLM) technical analysis:
Trade setup : Following a breakout from a Falling Wedge pattern, price spiked up to $0.19 where it got very overbought (RSI > 75) and traders took profits (selling pressure). Now it’s pulled back to support of $0.12 and is oversold (RSI ~ 30), which could be a swing entry level.
Trend : Downtrend on Short-Term basis, Neutral on Medium-Term basis and Uptrend on Long-Term basis.
Momentum is Bearish (MACD Line is below MACD Signal Line, and RSI is below 45).
Support and Resistance : Nearest Support Zone is $0.130, which it broke, then $0.120, and $0.100. The nearest Resistance Zone is $0.190.

XLM Sell TradeHere is My Study on XLM.
Welcome to my channel! Here you'll find daily technical analysis
ofthe latest trends in the crypto market. From Bitcoin to altcoins, I'lIl
be sharing my insights and predictions to help you make informed
decisions
This ls Not A Finacial Advise

XLMUSDTAfter a price increase of more than 150%, the price drop is a natural issue in the financial markets.
In addition, this week, the market situation was and is falling.
My prediction:
The first step is the decline to the S-1 range, and in the absence of support, the decline to the S-2 point is possible.
