XLMUSDT - Long by Supertrend 3/12/2022 4h timeframe: Supertrend indicator > Long.
- 1h timeframe: Wait a correction (Short) and breakout short for long to open a Buy follow 4h timeframe.
... Short correction (Supertrend 1h)
...Short correction be broken:
XLMUSDT trade ideas

XLMUSDTBullish breakout confirmed after falling wedge on Daily time frame at previous support of $0.1680
Divergence on OBV.
Waiting for retest to $0.1730-$0.1700

Moon is near!!!XLM forming a very nice bullish falling Wedge with expecting of a breakout sometime middle of this year. lambo is near!!

xlm looking good xlm is looking great to accumulate down here,
could potentially be close to breaking the down trend


it an ideaok Its chat pattan 4 hours candalr . congrats to those who bought around $0.38 . Around 45% profit in a single trade. Increase your stop loss and hold for maximum profit

One last dump before the real pamp?Been closely following XLM for the past year and a half, this coin ALWAYS bear traps before any real pump.
I can almost safely say at this point that we are going to see sub 16 cents before the real pump.
I even think its going to bear trap and form a massive hammer (this could momentally go under 10 cents even imo, but should not be for long, otherwise XLM might be screwed in the longer term).
I am bullish in the long term, but I don't think the dump is over.
This is NOT a financial advice.

xlmusdt4h downtrend line breakout and confirmation .
1D downtrend line breakout and confirmation .
an inversed head and shoulders.
wait for the pull back retesting the trend line and then wait until a two 4h candle to close above the trend line
and buy ,the targets are on the chart

XLMUSDT (Long)XLMUSDT in an upward trend
Long
Entry at 0.1939
Take Profit at 0.2007
Stop loss at 0.1883

XLMUSDT Long IdeaThe dip in price of crypto in recent month provide fair opportunity to buy. Target profit at around 0.60 cent for stellar.

XLMharder to chart since its the most boolish one ive seen recently. considering its already as low as itll go essentially, i cant see futher beyong .10 unless theres something devistating that happens im a buyer in the .20s just becuase long term this is probably good tech

STELLAR - BUYS READY 🚀Stellar is at a very nice level to buy. We're in a wedge and approaching the wedge support and double bottom.
Trade Idea:
- Watch for bullish pressure
- Enter with stops below the wedge
- Targets: 0.42, 0.77, actively manage the rest
Goodluck!

XLMUSDT BUY?We can see that the couple and handle shape is formed in the XLMUSDT pair. This is a sign of a strong uptrend soon.
GOOD LUCK!!!

XLM Scalp SignalStellar is healthily bouncing off the trend line, which makes for a quick scalp in the 4 Hourly time frame.

55th street planAll the custers thought I wouldnt Ce 5ccesful cut guess what cuh, Ima keep it 55th street regardless

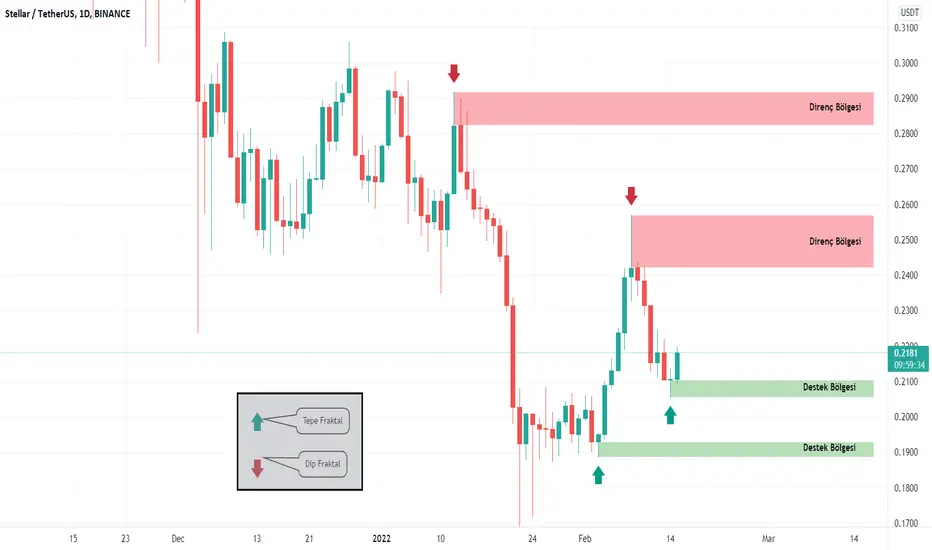
XLM/USDT - 18% - LONG XLM/USDT - 18% - LONG
Note - Bottom of of triangle potential bounce
Entry - 2179
Target 1 - 2394
Target 2 - 2578
Stop-Loss - 2046

XLMUSDTTwo different scenarios for the price of #XLM:
Hello Traders
If the Bitcoin price remains in the current stable position and does not lose its value in the following weeks, we can expect a rise in the price of XLM from its current price (0.2$) to 0.60 - 0.7$ in the next 3 months.
However, if the bitcoin loses its value again, the price will go down to the support area that is 0.13$ which can be a good opportunity for long-term investment. See the image below for more details.

Stellar XLMUSDT THE BEST TIME TO BUY I think stellar bullish around @0.12 target 4$ at September
Buy @ 0.12
Target @ 4 $
Stop out 0.07

$XLMUSDT - Possible rebound hereHello everyone!
Waiting for Stellar to close above this level, which is 0.786 of the last impulse wave.
Best of luck with your trades.

XLMUSDT - Long - Potential 22.95%XLMUSDT - Long - Potential 22.95%
Exchanges: Bittrex, KuCoin, Binance, Huobi.pro
Signal Type: Regular (Long)
Entry Targets:
1) 0.2368
Take-Profit Targets:
1) 0.2465
2) 0.2584
3) 0.2915
Stop Targets:
1) 0.20582
Entry Trigger - Stoch oversold

Stellar shortStellar bounced off the resistance area. Asset bounced off the descending trendline. Bearish movement to support level at 0.19 is expected to happen.

#XLMUSDT 4H Chart
Price previously took out the liquidity resting above the equal highs and moved up aggressively reaching the 6h supply zone at around $0.25 where it got rejected after breaking through the first supply around $0.225. It also left a 2D demand zone on its way up after bouncing from the level of equal lows. MACD is showing bullish weakness, RSI is bought and EMAs are bullish. Price may test the 2D demand around 0.205 before moving up again however it is probable that that will take out the liquidity resting below the equal lows at $0.19 then bounce from the next 1h demand zone around 0.185. Waiting for more confirmation.
