XLM higher high. 1.10$Combining Artificial Intelligence (AI) with Stellar Lumens (XLM) can create synergistic advancements in the blockchain and financial technology sectors. Here’s a detailed overview of how AI and XLM can intersect and the potential future impacts:
### Enhancing Stellar Lumens with AI
1. **Fraud Detection and Security**:
- **AI-Powered Monitoring**: AI can analyze transaction patterns on the Stellar network to detect unusual activities, potentially identifying and preventing fraud before it happens.
- **Smart Contract Security**: AI can help in auditing smart contracts deployed on the Stellar network, identifying vulnerabilities, and ensuring robustness against attacks.
2. **Automated Trading and Investment**:
- **Algorithmic Trading**: AI algorithms can be used for automated trading of XLM, optimizing trading strategies based on market data, sentiment analysis, and predictive modeling.
- **Robo-Advisors**: AI-driven robo-advisors can provide investment advice and manage XLM portfolios for users, tailoring strategies based on individual risk profiles and market conditions.
3. **Optimizing Network Performance**:
- **Load Balancing and Resource Allocation**: AI can dynamically adjust resource allocation and manage network load to ensure optimal performance and reduce transaction latency.
- **Predictive Maintenance**: By predicting potential network issues, AI can help preemptively address problems, maintaining the reliability and efficiency of the Stellar network.
### AI Applications Utilizing Stellar Lumens
1. **Cross-Border Payments and Remittances**:
- **Automated Exchange Rates**: AI can provide real-time exchange rate predictions and optimizations, ensuring users get the best rates for cross-border transactions using XLM.
- **Personalized Payment Solutions**: AI can offer tailored payment solutions based on users’ transaction history and preferences, improving user experience.
2. **Financial Inclusion**:
- **Credit Scoring**: AI can analyze non-traditional data to provide credit scores for underbanked populations, enabling them to access financial services through the Stellar network.
- **Microloans and Insurance**: AI can facilitate the provision of microloans and microinsurance products by assessing risk and potential for repayment, thereby aiding financial inclusion.
3. **Data Analysis and Insights**:
- **Market Analysis**: AI can analyze vast amounts of data from the Stellar network to provide insights into market trends, user behaviors, and transaction patterns.
- **Regulatory Compliance**: AI can help in monitoring compliance with regulatory requirements, ensuring transactions on the Stellar network adhere to necessary legal standards.
### Future Potential and Developments
1. **Decentralized Finance (DeFi)**:
- AI can enhance DeFi applications on Stellar by providing predictive analytics, optimizing yield farming strategies, and managing risks associated with decentralized lending and borrowing.
2. **AI-Driven DApps**:
- Development of decentralized applications (DApps) on the Stellar network that leverage AI for various purposes, from financial services to supply chain management.
3. **Interoperability and Integration**:
- AI can facilitate the interoperability of Stellar with other blockchains and financial systems, ensuring seamless integration and data exchange across platforms.
4. **User Experience and Adoption**:
- AI-driven interfaces can improve the user experience of Stellar-based applications, making them more intuitive and accessible, thereby driving adoption.
### Conclusion
The integration of AI with Stellar Lumens (XLM) holds significant promise for enhancing the functionality, security, and adoption of the Stellar network. By leveraging AI, Stellar can offer more efficient, secure, and user-friendly financial solutions, driving innovation in the blockchain and fintech spaces. The collaboration between AI and XLM can potentially revolutionize how financial transactions are conducted, making them more inclusive, accessible, and efficient.
XLMUST trade ideas

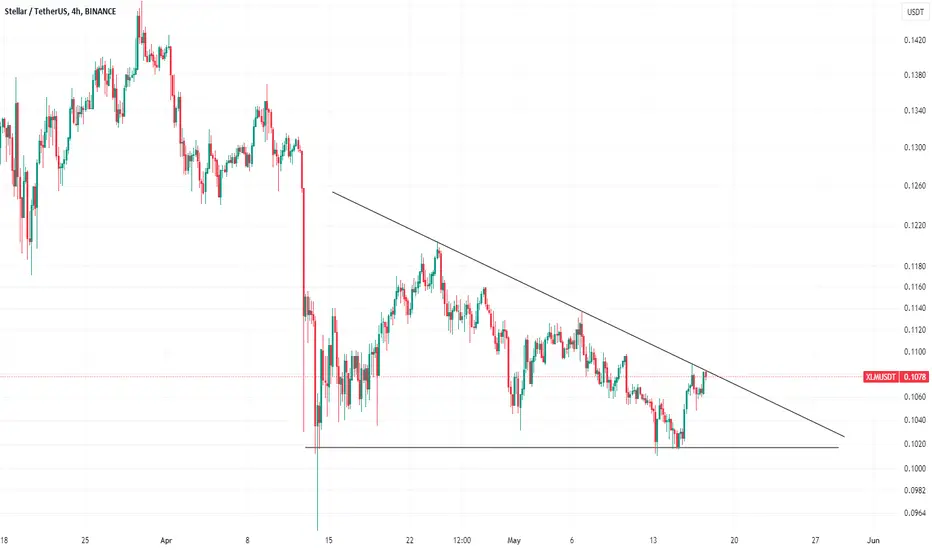
When Bull?The only way XLM can have a bullish rally is to hold above the blue trendline and create multiple strong green candles. price has been able to hold above the blue line, but has not been able to produce a strong bullish reversal. if a reversal does occur, 38-40 cent is achievable.

H&S ?This structure could be morphing into a Head & Shoulder. it definitely looks like one, but i will wait first for price to hit the neckline to confirm the structure. would not surprise me if price forms a lower low. the entire crypto has at least made a move to show that we are in a bull market. looking at xlm (turtle coin) chart, the only thing that comes to mind is that this asset is clearly still in a bear market. at this point, xlm cannot even be called an asset. at best, it is a liability. a car is a liability that you can use and do stuff with. with xlm, it is a liability that nobody is using. im not saying there will be no bull market for xlm, there may very well be one, but right now this is not the price action of an asset in bull market. Hodl n Get Rekt is the new motto for xlm. i will become bullish on xlm, when it starts acting bullish.

XLM (Stellar) Technical Analysis and Trade Idea 📈🚀Taking a comprehensive view of XLM (Stellar) , we observe a prevailing bullish trend, particularly evident when analyzing the weekly charts. Although there was a recent minor downturn, the daily chart exhibited bearish movements. However, the overall sentiment is optimistic once again. Notably, we’ve identified bullish price action—a decisive break in market structure on the 4-hour timeframe—which could potentially shift the 4-hour trend to bearish in trhe short term before it continueds bullish. In our video, we delve into trend analysis, explore price action dynamics, dissect market structure, and introduce key technical analysis concepts. Toward the video’s conclusion, we present a trade idea. It’s essential to emphasize that this information serves educational purposes only and should not be construed as financial advice. 📈🚀📊

Turtle Broke OutTurtle coin has broken out of the downtrend, and has found support right above the trend line. good news, but this asset is still acting like a baby turtle. too slow and getting rejected way too many times.

Lagging Behind as AlwaysTurtle coin struggles to break above every resistance level. there will be no sign of a healthy breakout to the upside as long as xlm behaves like a slow zombie. for the past 6 years the only thing xlm has been good for is breaking down below support levels and getting rejected by all resistance levels. i might keep posting bullish ideas for this coin to inject hopium, since the long term charts look bullish, but this post is as realistic as a post can be. xlm keeps getting f**** by the axis of resistance, but i guess lets hope for a day where the resistance levels turn into support for this miserable project. they say don't marry your bags, which is true, but i already did long before learning this fact.
XLM USDTXLM Setup. After confirming retesting the marked zone in green at 0.1038 we could take an entry. Remember stop loss is your friend. Everything is on the chart.
Entry 0.1055
S.L 0.0891
T.P 1 0.1186
T.P 2 0.1271
T.P 3 0.1357
T.P 4 0.1465

XLM/USDTA great opportunity is in front of your eyes. In my opinion, wave 2 is completed and I will buy for wave 3 with the targets indicated on the chart. The game of altcoins has just begun.

XLM/USDT Ready for a Swift Recovery From Current Downturn🚀👀💎Paradisers, gear up for a transformative phase in the #XLMUSDT market and highlights a potential bullish surge from its active demand zone.
💎Following two rounds of profit-taking, #Stellar has exhausted buy-side liquidity. This primes the scenario for a likely dip, setting up for a robust recovery from the pivotal Bullish OB zone at $0.1015. If LSE:XLM accrues sufficient bullish force, we anticipate a vigorous assault on the upper supply zone.
💎If #XLM falter in securing its foothold within this essential support zone, an immediate strategic shift may be essential. Our contingency, Plan B, involves triggering a bullish campaign from the deeper demand zone at $0.0909. This level is pivotal—if LSE:XLM breaches this threshold, it might herald the start of a bearish phase in the market's evolution.
💎Stay alert and flexible, Paradisers. Your ParadiseTeam is vigilantly overseeing the developments and ready to navigate you through the dynamic landscape of the #Stellar market.
MyCryptoParadise
iFeel the success

XLM/USDT presenting potential scenarios?👀🚀XLM analysis💎Paradisers, #XLMUSDT is navigating through a descending channel trajectory. Could this indicate a continued downtrend? Let’s dive into the analysis to see what the future might hold.
💎 Notably, #Stellar has broken below the downtrend trendline and is testing the support level at $0.1032. If it manages to sustain momentum, there's a possibility it could ascend towards the supply area above. Here, we're faced with two scenarios: if the price breaks above the supply area, we might see a bullish continuation towards a higher resistance zone. Conversely, if the price faces rejection at the supply level of $0.1194, it could attract sellers, potentially leading to a significant price drop.
💎 However, should #XLM lose momentum and fall below the support level of $0.1032, the likelihood of a prolonged bearish trend increases, possibly extending to lower support levels. In such volatile market conditions, maintaining vigilance and trading strategically are crucial for success.
MyCryptoParadise
iFeel the success🌴

#btc/usdt experienced a sharp correction but remains above the f#btc/usdt experienced a sharp correction but remains above the falling wedge trendline, with the RSI indicating oversold conditions🧐
Bullish trend confirmation: Bullish candle closures and breakout from the falling wedge📈
Bearish momentum confirmation: Sustained breakdown of the wedge📉

#XLM/USDT Stellar has broken out from a midterm descending chan#XLM/USDT
Stellar has broken out from a midterm descending channel🧐
The breakout has been confirmed by a successful retest of the channel resistance👨💻
A 300% bullish wave is expected for LSE:XLM in the upcoming weeks🚀

XLM mid-term play to 0.158Today I have randomly chosen XLM and this chart actually looks good.
Looking to break above the downtrend line and RSI downtrend line soon.
Entry: 0.11300
TP 1: 0.13041
TP 2: 014102
Finaly TP: 0.15816
Total around 40% upside.

Stellar XLM ABC AnalysisConsidering other altcoin analysis and the overall market, it is bullish. Volume is poor, but still bullish compared to other coins.
My channel also has an analysis that predicts 0.09, but it has now become invalid.
The analysis really starts to apply when the price reaches 0.1170
BS is present on the small graph, but not yet on the large one.
If in doubt, wait out the big chart BS
100% profit can be made with it
This coin is low compared to other coins and gives the impression that it is dead, but surprises are possible knowing that btc is still cheap.


XLM/USDT - Breakout of the year | Few more days left BINANCE:XLMUSDT (1D CHART) Technical Analysis Update
XLM is currently trading at $0.1356 and showing overall bullish sentiment
the price is currently around the resistance zone and the price was rejected around this resistance level 4 times in the past. This resistance level is very critical for the price to move above the resistance level. If the breaks the resistance then we can see a sudden pump in the price similar to the past.
Entry level: $ 0.1383 (After the breakout)
Stop Loss Level: $ 0.1221
TakeProfit 1: $ 0.1451
TakeProfit 2: $ 0.1531
TakeProfit 3: $ 0.1629
TakeProfit 4: $ 0.1753
TakeProfit 5: $ 0.1979
Max Leverage: 5x
Don't forget to keep stop loss.
Follow Our TradingView Account for More Technical Analysis Updates, | Like, Share and Comment Your thoughts.
Cheers
GreenCrypto

Stellar(XLM): Failed Push, Drop Incoming? Stellar has had some volatile times recently with pump and dump movements.
With that being said, if sellers take over that fake breakout zone, we might see a movement toward the 200EMA zone as a smaller correction!
Swallow Team

XLM's Situation: What Shall we Expect ?BINANCE:XLMUSDT
XLMUSDT produced the descending triangle on weekly timeframe💡
Bullish case if we manage to break upwards

XLMUSDT Elliott Waves Analysis (Longterm)Hello friends.
Please support my work by clicking the LIKE button👍(If you liked). Also i will appreciate for ur activity. Thank you!
Everything on the chart.
Entry: market and lower
Targets: 0.25 - 0.4 - 0.7 - 1$
SL: w/o stop
risk is justified
Good luck everyone!
Follow me on TRADINGView, if you don't want to miss my next analysis or signals.
It's not financial advice.
DYOR!

XLM. USDTApparently Mr. Jed McCaleb not only had a problem with the founders of Ripple, but he also has a fundamental inability to manage.
Even considering RD+ (4 h ), there is no change in the XLM trend, which is also due to the lack of support.
I hope Stellar can establish itself in the crypto market.
( I have no comment about Stellar.
Because it doesn't move based on technical ).

XLM looks bullishAfter branch i, which was the last symmetrical branch, the price has entered an upward phase of great degree, and now wave A and wave B of this phase have been completed. It seems that we are at the beginning of the bullish wave C.
From the green range, it is prone to jump up
If it reaches the green range, you can look for buy/long positions.
The targets are marked on the chart.
Closing a daily candle below the invalidation level will violate the analysis
For risk management, please don't forget stop loss and capital management
When we reach the first target, save some profit and then change the stop to entry
Comment if you have any questions
Thank You

XLMUSDT Monthly Technical AnalysisGreetings, traders and crypto enthusiasts! 🌟 Today, let's embark on a deep dive into the monthly technical analysis of XLMUSDT (Stellar Lumens against USDT). By exploring long-term trends and patterns, we aim to uncover valuable insights that could lead to profitable trading strategies. Join us as we navigate through the monthly charts to gain a comprehensive understanding of XLM's trajectory.
📊 Monthly charts provide a broader perspective on price movements, offering insights into long-term trends and potential opportunities. Let's delve into the essential technical aspects and uncover the factors shaping XLMUSDT's monthly trajectory.
🎯 Major Support and Resistance: Highlight major support and resistance levels that have historical significance on the monthly timeframe. These levels may influence price action and could serve as potential entry or exit points for traders.
🚀 Breakout Opportunities: Keep an eye on potential breakout opportunities above resistance levels or below support levels. Breakouts on the monthly timeframe can signal significant shifts in market sentiment and provide lucrative trading opportunities.
🛡️ While monthly charts offer valuable insights into long-term trends, it's essential to implement effective risk management strategies. Consider position sizing, setting stop-loss orders, and diversifying your portfolio to mitigate potential risks.
Monthly technical analysis provides valuable insights into long-term trends and potential trading opportunities for XLMUSDT. By understanding the broader market dynamics and key levels, traders can make informed decisions and capitalize on profitable trends in the crypto market.
Disclaimer: This analysis is for educational purposes only and should not be considered financial advice. Always conduct your research and consult with a financial advisor before making investment decisions.
#XLMUSDT #MonthlyAnalysis #TechnicalAnalysis #LongTermTrends #CryptoTrading #SupportAndResistance #MovingAverages #BreakoutOpportunities #RiskManagement #Cryptocurrency #Blockchain #TradingView

XLMUSDT Elliott Waves (Local Setup)Hello friends.
Please support my work by clicking the LIKE button👍(If you liked). Also i will appreciate for ur activity. Thank you!
Everything on the chart.
Entry: market and lower (im in pos from 0.135)
Targets: 0.16 and 0.18
after first target reached move ur stop to breakeven
Stop: ~0.113 (depending of ur risk). ALWAYS follow ur RM .
risk is justified
Good luck everyone!
Follow me on TRADINGView, if you don't want to miss my next analysis or signals.
It's not financial advice.
DYOR!
