🚀 XLM Breakout: A Bullish SIGNAL 💥XLM has recently broken out of a range and is currently retesting the upper boundary of the range. This is a very bullish signal, and it could also potentially be a signal from our indicator.
The breakout from the range is a strong indication that XLM is ready to move higher. The retesting of the upper boundary is a sign that bulls are in control and are looking to push the price even higher.
Of course, it is important to note that no one can predict the future with certainty. However, the breakout from the range and the bullish signal from our indicator are both positive signs for XLM.
What does this mean for crypto investors?
If you are a crypto investor, you should keep a close eye on XLM. The breakout from the range and the bullish signal from our indicator suggest that the price is likely to continue to rise.
If you are considering buying XLM, you may want to do so soon. The price is currently retesting the upper boundary of the range, which is a good opportunity to buy before the price moves higher.
However, it is important to remember that all investments carry risk. You should only invest what you can afford to lose, and you should carefully consider your own investment goals and risk tolerance before making any investment decisions.
❗️Get my 3 crypto trading indicators for FREE❗️ Link below🔑
XLMUST trade ideas

Stellar. USDTStellar is the biggest loser at the moment, but the scenario that can be considered is also clear.

Stellar Lumens to bounce from range lows?Stellar Lumens has traded within a range from $0.111 to $0.1334 since 17 August. The past few days saw the OBV dwindling to show reduced buying pressure, which suggested XLM might not be able to defend the range lows.
Yet, it represented a good risk-to-reward buying opportunity for aggressive buyers
Entry- $0.111 (retest of support in the event of a BTC dip could offer an ideal entry)
Take-profit- $0.1334 (range high)
SL- $0.106 (more conservative SL can be placed at the bottom of 17 Aug's lower wick at $0.1053)
R:R- 4.89 (could fail if BTC drops below the $25.8k mark)

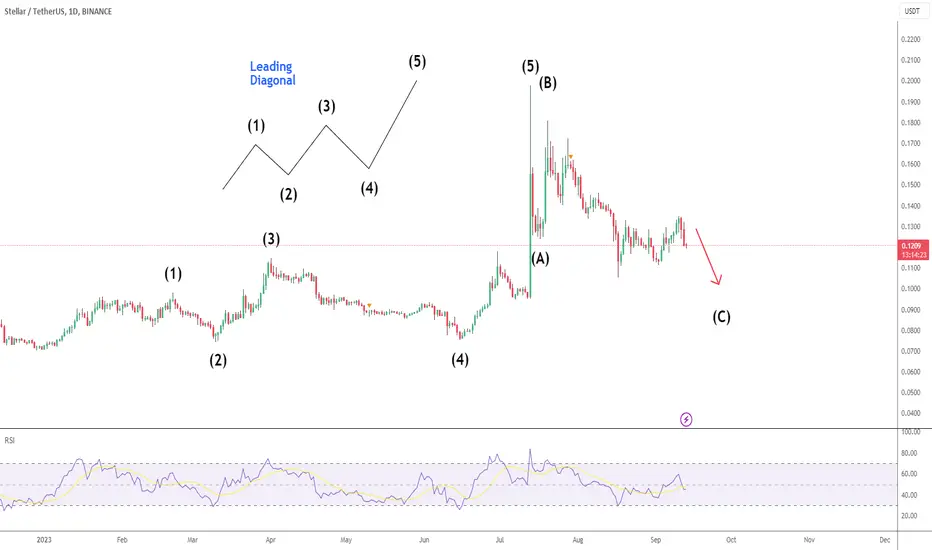
Just an ideaIn my analysis, XLM finished impulse wave 1, now in wave 2, due by year-end. Wave 3, likely explosive, hinges on Bitcoin's moves. Watch Ripple news and Bitcoin halving closely. Take it with a grain of salt and sugar.

XLM. Stellar for...In the long term, XLM can quadruple. The Stellar ecosystem, supported by smart contracts and some change of view on interactions with crypto-assets, is capable of quantitative growth. In the medium term, the price is targeted at twenty cents. We saw a good pump at the beginning of summer, again, in my opinion, this is due to the imminent launch of smart contracts and decentralized apps on the network. The volumes were significant.
In terms of blockchain development, Stellar stands apart. Perhaps their own vision prevails over the views of communities, but still they are looking for apps/utility in the real world... Which is very difficult, given the low involvement of people and territories in technology.

#XLM Bounce Zone, #STELLAR devam mi?Here i highlighted on the chart, this is good bounce zone for XLM, if #BTC does not dump , #stellar may bounce from this area and move up. NOT FINANCIAL ADVICE.
#XLM icin guzel bir bounce alani oldugunu dusunuyorum , bu destek asagi kirilir ve 4s kapatirsa stop olmak gerekir, #bitcoin de dump olmadigi surece bu destegin calismasini umarim. Yatirim tavsiyesi degildir.

XLM possible trade setupsXLM has braked structure to the upside with volume. We will wait either for a pullback or reclaim the 0.118 S/R reason

Is it worth entering STELLAR now or is it better to wait?Hello everyone!
I suggest taking a look at STELLAR (XLM).
After a explosive growth, the price of the asset has started to correct and in my opinion, it is currently at a good entry point. Although it can be seen on the chart that a level of price support has formed, and the price is also rubbing against the EMA 200. Entering from here might be a bit risky, but if you're willing, you can try and potentially gain almost 44% before price fixation. Personally, I think it's better to open a trade from the 0.236 Fibonacci level after the price breaks and tests it.
This is not financial advice, and everything you do is at your own risk.

XLMUSDT RECOVERY?Stellar price is now slowing down in support area is this a sign of incoming rally?
lack of interest in demand zone will cause price for another leg down.
But keep an eye for 4h RSI divergence as it build bullish divergence, if price fails to recover, target lows!!!

XLM is Most Likely Ready For a Correction | Stellar Analysis💎 Paradisers, turn your focus to XLM/USDT! The asset is presently traversing a clear descending channel and seems on the brink of a potential downward breakout.
💎 If this breakout materializes, brace yourselves for immediate correction in the XLM's price.
💎 It’s imperative to spotlight the two authenticated order blocks in a shorter timeframe. Given the prevailing liquidity, these areas are likely destinations for the Stellar.
💎 Reviewing historical movements, a shift from demand to supply has been observed, culminating in a notable decline in LSE:XLM 's price and aiming at the preceding Order Block (OB).
💎 In the dynamic realm of crypto, maintaining alertness and flexibility is paramount. Ensure your charts are up-to-date and stay connected for further insights!

XLM/USDT 1DAY UPDATE BY CRYPTOSANDERS !!Hello, welcome to this XLM/USDT update by CRYPTO SANDERS.
CHART ANALYSIS:- Stellar (XLM) was also in the green in today’s session, after two consecutive days of price declines.
XLM/USD peaked at 0.1154 earlier in the day, which comes less than 24 hours after falling to a low of 0.1122.
As a result of the decline, bulls continued to push the token away from a recent floor at 0.1100, and back on course toward resistance at 0.1320.
Today’s rebound was helped by the RSI reaching a floor of its own at 37.00, and it is now tracking at 39.87.
A ceiling at 44.00 now awaits bulls and could be the main hurdle preventing further gains this weekend.
I have tried to bring the best possible outcome to this chart.
Hit the like button if you like it and share your charts in the comments section.
Thank you.

xlmusdt-mentoringxlm-in terms of crypto quite a long living asset
was born after one of creators left xrp/ripple
this fact points that xlm more scm-border unnecessary project that servs funding
who knows who.
but its defenatly tradebale
and on weekly its looks kinda bottoming. but i have strange filling that this level of 11228 wount hold. if holds can be nice upswing to atleast 19564
look for long if close above 11546
look for short if close under 11228
***
Tolerance will reach such a level that intelligent people will be banned from thinking so as not to offend the imbeciles- F.M.dostoyevsky

Rising Wedge on XLMXLM is breaking a Rising Wedge. The Rising Wedge is a bearish chart pattern. In this case the price maybe be go down at least to 0.11217

XLMUSD ❕ narrow rangeXLM fixed above 50EMA (1H TF)
Trading volumes remain stable.
RSI is around neutral values.
I expect the price to rise after fixing above the resistance level.

xlmusdthello bro... this is just an idea, actually this is just a scenario in analyzing future movements, so don't ever use this as a reference for buying or selling in the market... or just call it a prediction. ..

XLM/USDT 1DAY UPDATE BY CRYPTOSANDERS !!hello, welcome to this XLM/USDT update by CRYPTO SANDERS.
CHART ANALYSIS:- On the other side of the spectrum was stellar (XLM), which dropped by over 8% in today’s session.
XLM/USD bottomed out at 0.1195 on Wednesday, less than 24 hours after residing at a high of 0.1318.
This drop in price saw the token fall for a third consecutive day, falling below a floor of 0.1200 in the process.
It appears that today’s sell-off coincided with the RSI failing to remain above a point of support at 49.00.
Price strength is now tracking at 44.53, with the next visible zone of stability around the 37.00 region.
In the event that this level is reached, XLM will likely be trading under 0.1100.
I have tried to bring the best possible outcome to this chart.
Hit the like button if you like it and share your charts in the comments section.
Thank you

XLMUSDTThis is a 1D frame analysis for XLMUSDT As we can see, we can observe a double bottom pattern which after the failure and the uptrend is currently heading towards a support line and after the slow patterns we can take from the market in a stepped manner for higher numbers. Keep in mind that there is a possibility that the price may start a movement from the first support line to the second support line after the drop, so keep an eye on both zones.

xlm, abc analysis, c pointIt seems that our Stellar is actually like this if we also consider the analysis of btc, bnb, xrp.
First a small drop and then a big rise.

XLM - Be Patient With the Correction
The correction on the daily chart has played out in line with my primary wave count.
Even though I believe we are on the final stages of this correction, the lack of RSI divergence and sideways price action still points to another leg down before any significant upside.
XLM/USDT Potential Bullish MovementHey traders👋
XLM coin is another one we will be talking about today where we see a further bullish movement to continue here! We are that price has been on a nice small bullish trend here where price is pushing and pushing slowly to reach that upper resistance zone. We want to see price to reach that resistance zone before we will look for a potential short position!
If you like ideas provided by our team you can show us your support by liking and commenting.
Yours Sincerely,
Swallow Team
Disclamer:
We are not financial advisors. The content that we share on this website are for educational purposes and are our own personal opinions.

#XLM/USDT retested the line successfully in 1-Hour TF!#XLM/USDT retested the line successfully in 1-Hour TF!
Shorting CRYPTOCAP:XLM , expecting some bearish momentum.
XLM UpdateIt is expecting to do a retest at these levels in small time frames and it is holding its price levels.
The yellow area will be the main support for the price for now and there is a minor trend that must be considered until it builds up
Expect high volatility during these days with the upcoming news from the US FED this week
XLMUSDT.PHi Traders,
XLM got rejected once again at 0.13277 area, I see it has found limited support around 0.01290
I believe due to repeat rejections we might see dropping lower to around 0.12655:
Worse case scenario if BTC falls below 25k, we might see XLM drop to previous low levels of 0.12
