xlm usdtAccording to the structure of this coin, we can see that the volume of the drop, which was from the ceiling, has not been confirmed, and with the drop of the starting price, the volume has also been decreasing. And also we can see a trend line which is currently broken and its entry point is the same as the weekly box failure.
XLMUST trade ideas

XLMUSDT 4HIn the 4-hour time frame, we have an upward trend, and with the break of our trend line and then with the break of 0.949, which is the lower floor, we can open a short position and the price will move up to 0.075.

XLMUSDT 1DIn the daily chart, we are in a box, and with the failure of 0.1120, we can apply for a long position, and with the failure of 0.755, we can apply for a short position.

XLMUSDT WIn the weekly time frame, if the price can break 0.13, it can be bullish because the downward trend line has been broken, and when the 0.13 line is broken, it gives us an entry trigger.


XLM/USDT strong demand zoneI see a very important demand area that can reject the price
Anyway, I will wait to get confirmation and enter into the transaction with more confidence
Although it has a good risk-to-reward ratio

XLMUSDT - Breaking through bearish trend resistanceBINANCE:XLMUSDT forms the bottom, relative to which the price develops positive dynamics. After testing 0.0758, a rally is formed and the price makes a retest of the trend resistance.
As we can see, a three-day accumulation is formed in relation to the resistance. The market is obviously ready to continue rising, but in order to do that the price needs to overcome the resistance.
The resistance at 0.1035 is worth mentioning. The bulls may fight hard for this level and if they manage to hold this area, the coin will show a good result in the middle term, because the level of 0.1035 is the range support, whereas the resistance and the target for the price may be the upper boundary at 0.1305.
Support levels: 0.0959 and 0.0987.
Resistance levels: upper trendline, 0.1035, 0.1130
I expect a confident bullish position above the level of 0.1035. An indicator for this will be consolidation above the level. Medium-term perspective - growth up to 0.1305.
Regards R. Linda!

XLMUSDT pullback to daily support for attempt at monthly resistThe price is currently trading below a confluence of monthly and weekly resistance. It had an attempt to break this resistance a few months back but could not succeed and it fell back to the weekly support again. That support provided the strength and the price bounced again to that confluence of resistance. The price is again facing pull back from that resistance zone MR1+WR1. I believe that pullback will make the price land on daily support DS1 and will bounce from there. I expect the price to attempt at the MR1+WR1 zone again from the bounce from DS1. Lets see if it can break this. In case it does, the next target shall be monthly resistance MR2 which is sitting around 0.197-0.229. The price may struggle for a while around 0.145 on its way to MR2 in case it breaks the MR1 resistance.

XLMDisclaimer
High Risk Investment
Trading cryptocurrencies and Forex carries a high level of risk, and may not be suitable for all investors. Before deciding to trade cryptocurrency you should carefully consider your investment objectives, level of experience, and risk appetite. The possibility exists that you could sustain a loss of some or all of your initial investment and therefore you should not invest money that you cannot afford to lose. You should be aware of all the risks associated with cryptocurrency and Forex trading, and seek advice from an independent financial advisor. Since Any opinions, news, research, analyses, prices, or other information contained on this website is provided as general market commentary, and does not constitute investment advice. The Bibres will not accept liability for any loss or damage, including without limitation to, any loss of profit, which may arise directly or indirectly from use of or reliance on such information. All opinions expressed are owned by the respective writer and should never be considered as advice in any form.
A qualified professional should be consulted before making any financial decisions.
-------------------------------------------------------------------------------------------------------------------

Stellar long100% bullish after this bounce, it's clean , stop loss as in the chart, or on your risk management strategy BINANCE:XLMUSDT

XLM S&R>>>>>>>>>>>>>I Have Tried My Best to Bring the best Possible outcome in this Chart.
XLM moving in the short term uptrend and have a good chance to more rising price and support form each marked area's support.
All supply and resistance's marked on the chart you can scroll your mouse on the chart picture.
It's Not a financial advise.
PLZ DYOR
With hopping success>>>>>>

Rounding Bottom Signal Potential UpsideTitle: XLMUSDT Trade Setup: Rounding Bottom Pattern Signals Potential Upside Move
Introduction:
In this article, we will analyze the current trading pattern of XLMUSDT on the daily time frame. XLMUSDT is currently trading in a rounding bottom pattern, with the price undergoing consolidation from June 3rd to June 26th. As the price nears the trendline resistance, there is a possibility of further upside momentum. A measured move can be derived based on the pattern range, providing a potential trade setup. This article suggests a buy entry at $0.0888, with a target set at $0.1125 and a stop loss at $0.0852. Let's dive into the details of this trade setup.
Technical Analysis:
XLMUSDT is currently trading in a rounding bottom pattern on the daily time frame. The consolidation phase from June 3rd to June 26th indicates a period of indecision and accumulation. With the price approaching the trendline resistance, there is potential for further upside move.
Trade Setup:
Buy Entry: Based on the rounding bottom pattern and the potential upside momentum, a buy entry can be considered at $0.0888. This entry point aligns with the expectation of a bullish move following the consolidation.
Target: Our target for this trade setup is set at $0.1125, representing a significant upside potential from the entry level. This target is derived based on the measured move of the pattern range, indicating the anticipated price movement.
Stop Loss: To manage risk effectively, it is recommended to set a stop loss at $0.0852. Placing the stop loss below the entry level can help protect against potential downside risks.
Timeframe and Confirmation:
Given that our analysis is based on the daily time frame, it is important to monitor the price action for confirmation of the anticipated upside move. Traders should watch for a decisive breakout above the trendline resistance, accompanied by increased buying volume and sustained bullish price action. Once the breakout is confirmed, we expect the price to move towards the target of $0.1125. The timeframe for this trade setup may vary, but it is anticipated to unfold within a few days or weeks, considering the historical price patterns and the potential momentum from the breakout.
Conclusion:
XLMUSDT is currently trading in a rounding bottom pattern on the daily time frame, suggesting the potential for an upside move. The consolidation phase from June 3rd to June 26th indicates a period of accumulation. Based on this pattern and the measured move, a trade setup suggests a buy entry at $0.0888, with a target set at $0.1125 and a stop loss at $0.0852. Traders should exercise caution, closely monitor the price action for confirmation of the breakout, and adapt their trading strategies accordingly.

XLMUSDTHello Crypto Lovers, This is a 1D frame analysis for XLMUSDT After hitting the second support line, the price had a slight dip but the buying pressure pushed the price back up above the support line. Since then, the price has been able to gain 38% progress. Currently, the price is facing the first resistance line and there is a possibility of a correction if it fails to break above it today. However, if it is able to break above the first resistance line, we expect it to progress towards the second resistance line. Warning: This is just a suggestion and we do not guarantee profits. We advise you to analyze the chart before opening any positions. Take care

xmlusdt analysisBased on shado strategy and resistance support for this moment, I suggest sell position

Xlm Getting Ready For Another 100 to 120% Bullish Wave seems Like Getting Ready For Another Bullish Wave Falling Wedge Breakout & Retest Has already Done Now Formed Inverted Heads & Shoulders Incase Of Breakout expecting Another 100 to 120% bullish Wave

🔥 XLM Best Multi Year Trade With Massive Reward!This trade is based on the idea that the bear market bottom is in for XLM and that it gradually increase in value until the next bull market top.
As seen on the chart, we can draw a bullish channel on XLM's price chart. The top of the channel is the target, the stop is just below the channel's support.
This trade has a massive risk-reward ratio because it's a long-term trade, think multiple years. If you have the patience, this trade could be something for you!

XLMUSDT Trading RangesThe blue boxes show signs of previous strength in those price ranges. We see weakness in the trading range highlight in the yellow box. The upper blue box shows stronger historical price action. This upper blue box could act as initial resistance. Currently we are seeing strength in the current accumulation phase and seem to be sticking to a solid price range that could act as future support. The 2 green arrows indicate possible resistance points should we break out of the current range.

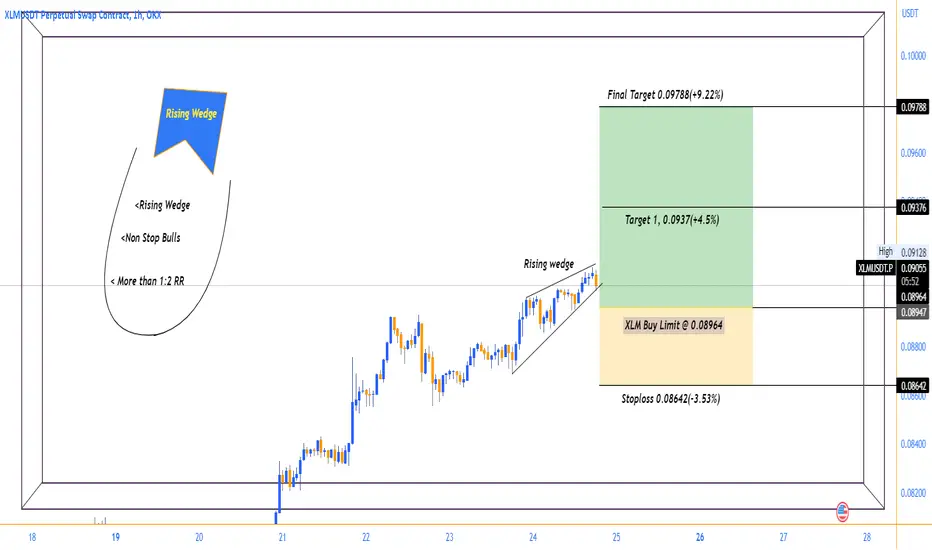
XLM: Bullish strengthHello Traders!
Welcome back to another trade with analyst Aadil1000x.
Today we are going to Buy XLM as the bullish target is not yet complete and there is a rising wedge which is a nice bullish pattern.
XLM Buy Limit @ 0.08964
Stoploss 0.08642(-3.53%)
Target 1, 0.0937(+4.5%)
Final Target 0.09788(+9.22%)
Don't forget to hit the like button and follow to stay connected.
XLM STELLAR SHORT SETUP 2hXLMUSDT (#STELLAR) seems is prepared for correction along with BTC. So, I think we can short it after a small recovery. DYOR. NFA. Lets see what happens.

xlmWe are in a resistance zone, which are red lines, in the first step, it can react to the green box, and if there is no support, it can touch the lower lines.
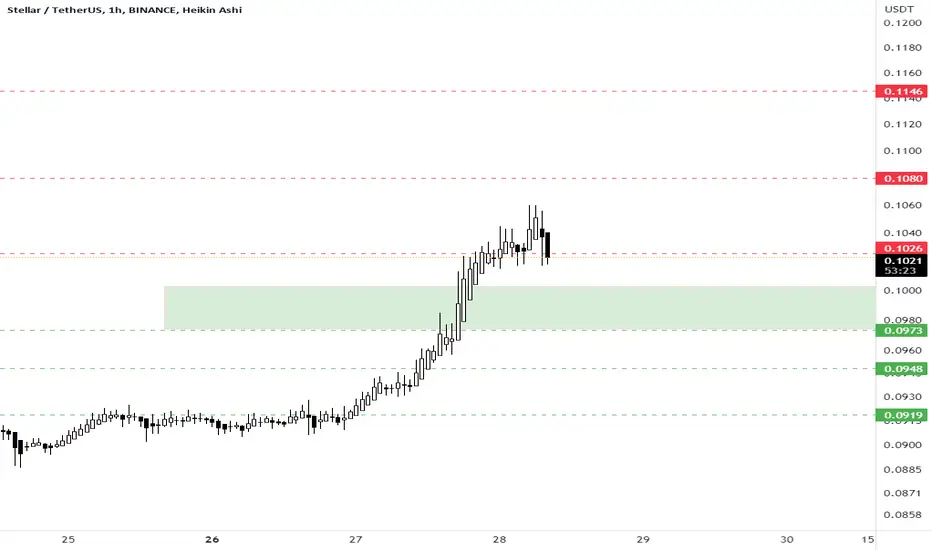
XLMUSD ❕ above the rangeTrading volumes are up.
50EMA broke through 200EMA on 4H TF.
The asset is overbought now, but after the retest of the support, the price will continue to rise.
