Coin XLM ?
Basic principle of flag.
From reducing volume. I anticipate that by the trend of volume. I see no sellers for now.
It's a 1:1 trade.
Care for your risk.
All the best
XLMUST trade ideas

XLM - Good Time to BAG RROFITS 💰Hi Traders, Investors and Speculators of the Charts 📈📉
Ev here. Been trading crypto since 2017 and later got into stocks. I have 3 board exams on financial markets and studied economics from a top tier university for a year.
Taking a quick look at Stellar / XLMUSDT which already increased nearly 60%. This is an altcoin that's been on my watchlist since early this year, and I believe a pullback seems logical from this point.
The technical indicators RSI is showing overbought in the weekly. The Momentum in lower timeframes shows that sellers are taking control and the LSMA has fallen under 50.
This point to a possible short term correction, which is only natural after a bullish 60% upward move.
While you're here 👀 Check out LINKUSDT :
My early accumulation plan for XLM :
_______________________
📢Follow us here on TradingView for daily updates and trade ideas on crypto , stocks and commodities 💎Hit like & Follow 👍
We thank you for your support !
CryptoCheck

XLMUSDT: Buy Opportunity Ahead?"Hey there! So, I've been keeping an eye on XLMUSDT, and I've noticed that the price has broken its downward trendline after 300 days with large volume. This could mean that we might see some bullish action soon.
However, I do think that there might be a bit of a pullback in the near future. In the pullback area, we've got a few potential support levels, like a horizontal support level, SMA200, and monthly pivot, that could help prop up the price and give us a chance to buy in at a good price.
Overall, things are looking pretty positive for XLMUSDT, but it's always a good idea to wait for candlestick confirmation before making any trading decisions.

Stellar #Bullishwe saw a significant breach through a really strong trendline since yesterday and #XLM can, in optimistic scenario, indicate such bull run in the near future

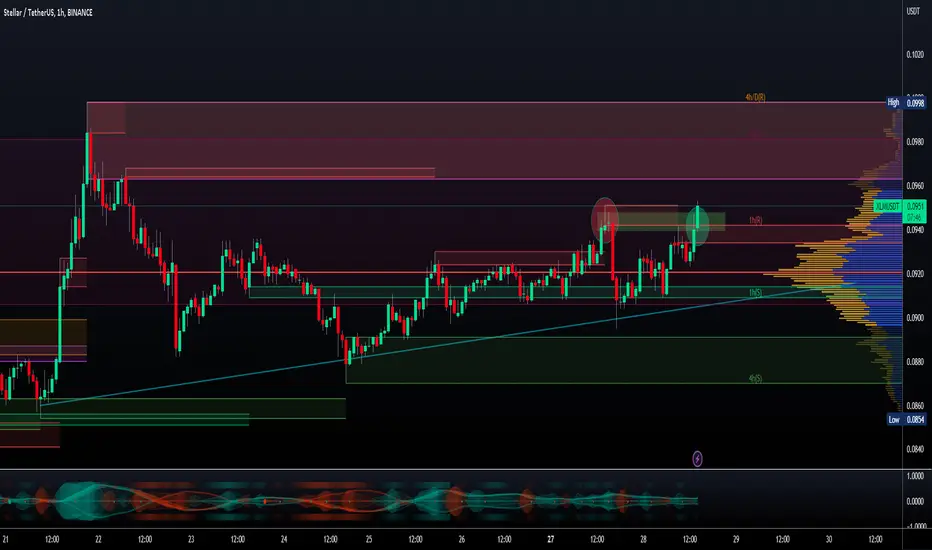
RLinda ! XLMUSDT -> Retest of the resistance zoneXLMUSDT after a false breakdown of the liquidity zone comes out of the wedge upwards and forms a momentum. Price is testing resistance at 0.0959 and confirms the limit zone. What's next?
Next we have a pre-breakdown consolidation and retest resistance at 0.0959. There is a chance to break through the resistance area. In this case the bulls will have the potential to grow towards 0.1400.
I expect breakout of the resistance at 0.0959 on the retest. The short-term target is the resistance at 0.1160, the medium-term target is the liquidity zone at 0.1400.
Regards R.Linda!

✴️ Stellar Enters Bullish Cycle | 5-Steps PatternStellar (XLMUSDT) is moving ahead of the pack and just hit a 5 months high.
Let's see what this chart has to say.
First, let's focus on the 5-Step Pattern we've been looking at today.
This pattern consists of #1, the Dec. 2022 low.
#2 | January's 2023 bullish breakout.
#3 | The correction that ended mid-March (10-March).
#4 | The resumption of the bullish trend and #5 the new high, in this case we are aiming at $0.18 based on the Fib. extension numbers.
This is the same pattern we saw with Cardano, ChainLink, Terra, etc.
Now, let's review some of the classic signals.
- Really high buy volume in the past few days. The highest buying pressure since 2021.
- Very strong indicators. RSI and MACD... The rest is history.
What one does, the rest follows!
Expect for the rest of the market to grow as well.
You can find XLMBTC in the "Related Ideas" below.
Thank you for reading and for your continued support.
Namaste.

XLM/USDT - Stellar: Resistance_Breakout_Confirmation◳◱ A Resistance Breakout and Confirmation has been detected on the $XLM / $USDT chart. The price has broken above a key resistance level and has been confirmed by a strong candle, indicating a potential bullish trend. The next resistance key levels are located at 0.0993 | 0.1067 | 0.1211, and the major support zones can be found at 0.0849 | 0.0779 | 0.0635. Consider entering a trade at the current price zone of 0.0951 and targeting higher levels.
◰◲ General info :
▣ Name: Stellar
▣ Rank: 28
▣ Exchanges: Binance, Kucoin, Bybit, Huobipro, Gateio, Poloniex
▣ Category/Sector: Payments - Currencies
▣ Overview: Stellar is an open-source payments network that serves as a distributed intermediary blockchain for global financial systems and circulates a native asset, Stellar Lumens (XLM). The Stellar blockchain allows anyone to issue new assets in the network and exchange for other assets via built-in asset exchange features. Assets on Stellar are issued and redeemed by anchors, who are trusted entities that issue digital credits on the Stellar network in exchange for deposits of the asset with the trusted entity. Anchors enable real world assets to be exchanged on Stellar by leveraging a distributed exchange that maintains an order book for every asset pair. Stellar supports the issuance of any type of asset including stocks, currencies, cryptoassets and more.
◰◲ Technical Metrics :
▣ Mrkt Price: 0.0951 ₮
▣ 24HVol: 9,909,925.430 ₮
▣ 24H Chng: 0.955%
▣ 7-Days Chng: -2.29%
▣ 1-Month Chng: 6.01%
▣ 3-Months Chng: 31.73%
◲◰ Pivot Points - Levels :
◥ Resistance: 0.0993 | 0.1067 | 0.1211
◢ Support: 0.0849 | 0.0779 | 0.0635
◱◳ Indicators recommendation :
▣ Oscillators: BUY
▣ Moving Averages: STRONG_BUY
◰◲ Technical Indicators Summary : STRONG_BUY
◲◰ Sharpe Ratios :
▣ Last 30D: 0.97
▣ Last 90D: 1.76
▣ Last 1-Y: -0.78
▣ Last 3-Y: 0.74
◲◰ Volatility :
▣ Last 30D: 0.64
▣ Last 90D: 0.54
▣ Last 1-Y: 0.73
▣ Last 3-Y: 1.13
◳◰ Market Sentiment Index :
▣ News sentiment score is N/A
▣ Twitter sentiment score is 0.62 - Bullish
▣ Reddit sentiment score is 0.47 - Bearish
▣ In-depth XLMUSDT technical analysis on Tradingview TA page
▣ What do you think of this analysis? Share your insights and let's discuss in the comments below. Your like, follow and support would be greatly appreciated!
◲ Disclaimer
Please note that the information and publications provided are for informational purposes only and should not be construed as financial, investment, trading, or any other type of advice or recommendation. We encourage you to conduct your own research and consult with a qualified professional before making any financial decisions. The use of the information provided is solely at your own risk.
▣ Welcome to the home of charting big: TradingView
Benefit from a ton of financial analysis features, instruments and data. Have a look around, and if you do choose to go with an upgraded plan, you'll get up to $30.
Discover it here - affiliate link -
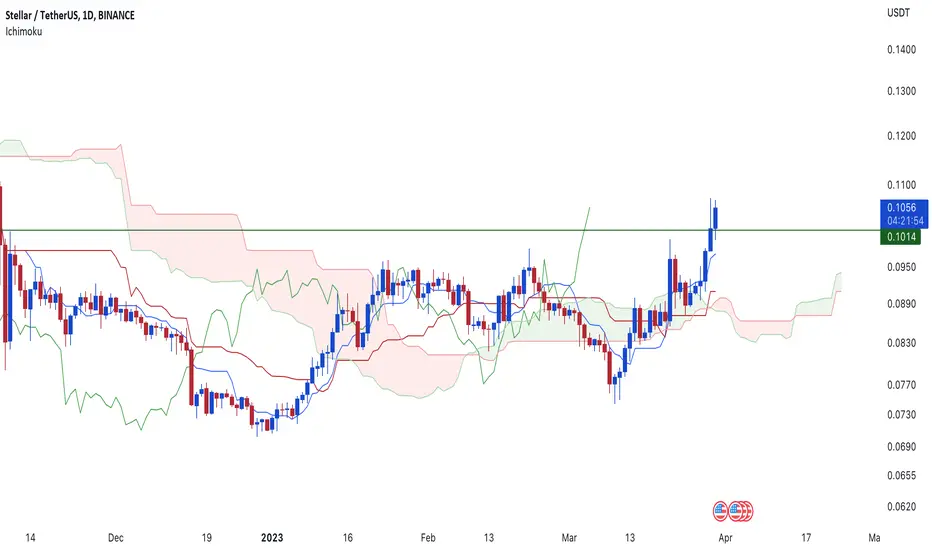
Ichimoku Analysis for XLMWill long $XLM if closes above 0.1043 today. SL will be closing below tenkan support.
#XLMUSDT #LQR #TOBTC #LaqiraProtocol The price is in the resistance Level
minor and major resistances in the specified chart,
if confirmed you can open a trade
Note: In any resistance Level as much as its potential (minor and major) Level expect to react
this analysis is not an offer to buy or sell

Let's look into my lovely coin #XLMMultiple tools show me that #xlm is on top for now, Depending on the decision of the market, I will #wait for the choice of the new direction of the #staller.
Important #supports and #resistances have been identified .
#Sadegh_Elaypo

Let look in to my lovely coin ,#XLM Multiple tools show me that #xlm is on top for now, Depending on the decision of the market, I will #wait for the choice of the new direction of the #staller.
Important #supports and #resistances have been identified .
#Sadegh_Elaypo

XLM: Updae - Will Stelar Rise More?XLM: Will Stelar Rise More?
During these days with the banking crisis BTC and ETH both benefited a lot
from the banking crisis.
The high speculation helped BTC to rise from 22k to 28.8K
Probably when the money will be released from BTC and ETH then we may see altcoins move again.
In the current price position, XLM looks like it will rise even more.
The price is already above teh pattern and it may rise further during the coming weeks.
Thank you and Good Luck!

an update on XLM's Bullish trendPrice finally managed to break the triangle.the price can easily reach the target(0.13) after a little correction.
Previous Analysis:
✅Access trading ideas, build strategies with drag and drop, backtest, and automate your trading for passive income with our Sponsor's platform Vestinda. check it out using the link in the Description.
_ _ _ _ _ _ _ _ _ _ _ _ _ _ _ _ _ _ _ _ _ _ _ _ _ _ _ _ _ _ _ _ _
🌍Thank you for seeing idea .
Have a nice day and Good luck.

XLM Swing Long SetupIt is a perfect time for all of us to zoom out, and get into long position and most of alts for second leg of this mini bull run.
My price entry is based on weekly chart and its price entry on first leg.
Also, I see a LL on BTC pair+Its making a double bottom.
I am expecting a god candle after reaching my entry point, so its better to make a stop limit order.
Lets see

XLMUSDT LONG POSITIONMy previous posts has been on this pair. It has respected analysis ever since. I expect a retracement on the Daily TF to a strong OB then we resume our journey upwards.

$XLM/USDT 12h (#Bybit) Falling broadening wedge breakoutStellar Lumens looks good for bullish continuation from here after pulling back to 100EMA support.
⚡️⚡️ #XLM/USDT ⚡️⚡️
Exchanges: ByBit USDT, Binance Futures
Signal Type: Regular (LONG)
Leverage: Isolated (5x)
Amount: 6.2%
Current Price:
0.09070
Entry Targets:
0.09060 - 0.08800
Take-Profit Targets:
1) 0.09625
2) 0.10150
3) 0.10670
Stop Targets:
1) 0.08350
Published By: @Zblaba
$XLM #XLMUSDT #StellarLumens
Risk/Reward= 1:1.2 | 1:2.1 | 1:3.0
Expected Profit= +38.9% | +68.3% | +97.4%
Possible Loss= -43.2%
Estimated Gaintime= 1 month

XLMUSDT Elliott Waves AnalysisHello friends.
Please support my work by clicking the LIKE button👍(If you liked). Also i will appreciate for ur activity. Thank you!
Everything on the chart. (update)
Everything according plan.
Entry: market and lower
Targets: 0.1 - 0.115 - 0.13
after first target reached move ur stop to breakeven
Stop: ~0.074(depending of ur risk). ALWAYS follow ur RM .
risk is justified
Good luck everyone!
Follow me on TRADINGView, if you don't want to miss my next analysis or signals.
It's not financial advice.
Dont Forget, always make your own research before to trade my ideas!
Open to any questions and suggestions.

long positionAs you can see, Stellar has taken an upward trend and you can target in the following steps
step 1 : 0.1108
step 2: 0.1165

Xlm Breaking Falling Wedge Seems Like Xlm Has Already Bottomed Out And Looks Ready for Massive recovery In coming Weeks
Breaking Falling Wedge In 3 days Tf Incase Of successful Breakout expecting 400 to 450% bullish Move


XLM accumulation LONG term opportunityHello everyone.
With XRP being bullish, why not be bullish in XLM too ? Targets provided above.

XLMUSDTPERP SCALP IDEADid another 1 mins scalp on XLM again. Riding this till it hits my Daily TF POI or it changes direction i.e break market structure.

XLMUSDT scalp idea Reaction on a Daily OB already moving nicely. Running up 1 minute scalps as it journey towards the most previous Daily swing high.
