XLM: Another LONG OpportunityXLM: Another LONG Opportunity
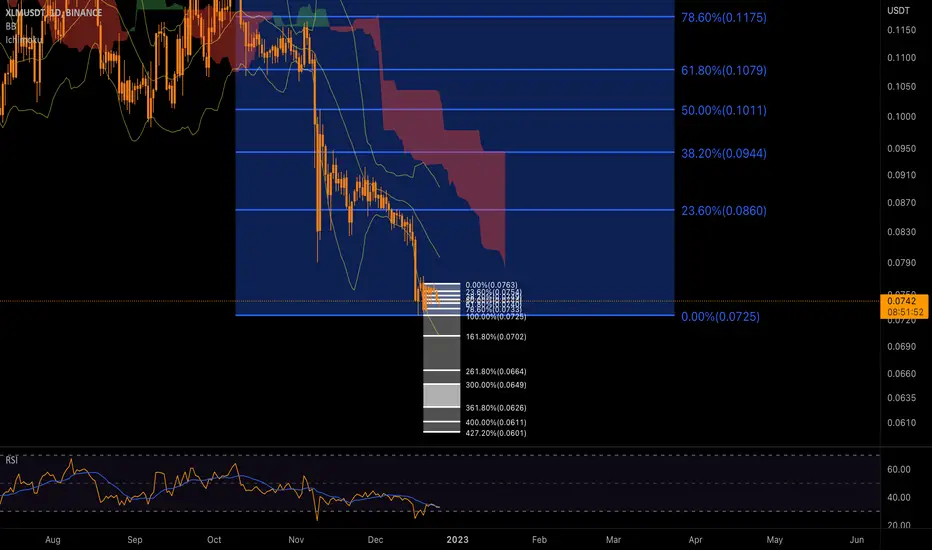
Whenever the price tested the lower support zone, we can see that it was followed by a strong bullish move.
Currently, the price is retesting the area and probably the market is picking up the bullish volume again after the FTX crash.
So to keep it simple, we need optimism in the market so that bullish volume can come again and drive the price up.
The minimum target I expect is +20% to +45%
Thank you and Good Luck!
XLMUST trade ideas


The formed divergence can only cause a pullback in the downtrendXLM had good price increase over the past week. In the previous analysis, we had given the possibility of a reversal according to the double bottom pattern formed, which was confirmed exactly by the breaking of the resistance of the $0.0725 range, and the pullback to this support caused the price to grow to a higher resistance in the $0.075 range. One of the important resistances is considered in the range of $0.077. This resistance overlaps with the downtrend line, and its break could change the trend in the 4-hour time frame. Now the XLM trend is in the 4-hour range. On the daily time frame, the RSI indicator needs to return above the 60 level for a trend reversal. Otherwise, the formed divergence can only cause a pullback in the downward trend. The next resistance levels are considered in case of increasing strength of buyers at the prices of 0.082 and 0.090 dollars.


#Stellar Firm from $0.07 as XLM Trading Volumes SwellPast Performance of Stellar
Stellar prices are up five percent from December lows. Per the XLMUSDT price action, buyers appear to be taking charge after steep losses last year. XLM plunged 77 percent from January 2022, dropping as low as $0.070 by the end year. However, things are beginning to look up for buyers following gains on January 2.
#Stellar Technical Analysis
Overall, XLM prices are bearish from a top-down preview. The primary support is at $0.07, flashing with December 2022 lows. On the other hand, primary resistance is at $0.077, coinciding with December 19 highs. Following the gains of January 2, aggressive traders can look to double down their positions, targeting the short-term resistance level. It is worth noting that prices are higher with rising trading volumes, a positive development. Further gains above $0.077 and middle BB may pump XLM towards December 16 highs at $0.082 as the coin bottoms up.
What to Expect from #XLM?
There are higher highs relative to the lower BB though the downtrend remains. Going forward, sellers remain in control, and XLM must clear the above immediate liquidation lines for buyers to establish themselves.
Resistance level to watch out for: $0.077
Support level to watch out for: $0.070
Disclaimer: Opinions expressed are not investment advice. Do your research.

XLM - Probability of retesting the support levelXLM has been in a gentle downward trend over the past week, and the price has entered a range that has raised the possibility of a complete breakdown of the monthly time frame support. The downtrend line that was considered on the chart has not yet been broken and the price is far away from the downtrend line. A resistance is considered in the range of $0.0777, which is the ceiling range of the last bearish wave in the 4-hour timeframe. On the other hand, a double bottom pattern is formed in the range of $0.0710, which the break of the $0.0725 resistance can confirm this pattern.
Of course, if a bullish candle is formed above this area. In this case, we can expect for the next week that the buyers will make an attempt to return the price to the specified dynamic resistances. After a possible reaction to this resistance, there is a possibility of a retest of the support level and the formation of a double bottom pattern, which is confirmed by the failure of the resistance pattern. In this case, we can consider higher targets in the ranges of 0.082 and 0.090 dollars.

XLM - Technical review and analysisXLM had quite a range trend last week. Still, due to the selling pressure over the currency two weeks ago, which neutralized the reversal scenarios, the previous floor in the $0.080 range was completely broken, and the area is now facing resistance. It has become serious and important. Also, the dynamic resistance that we considered from the past on the chart overlaps with the static resistance, and we cannot expect to break these levels, at least in the first encounter.
The buyer's lack of willingness and power in this currency has caused its price to return to very sensitive areas in the weekly time frame. The current support being broken is exactly at the range where a strong upward move from this level was seen in 2020. But the second support is within the scope of changing the price trend from downward to upward in 2020. Therefore, the second range has a very high power to reverse the trend and a positive swing in the short term.
YongTung | XLM: Over 500% Profits! Last Chance To Buy Low!Hello traders, today I want to talk to you about XLMUSDT.
I made a few conclusions about Stellar.
At the moment XLM price trades near to support line $0.0710 level.
I expect that price can make small correction to support level and then bounce up and start to rise.
Then, I think price can break resistance line and go higher.
I set up my first target locate at the local high and resistance level $0.2796 (blue line).
Also, I think price can break resistance level and continue move up until resistance zone.
Therefore I set up second target at $0.4119 (orange line) and $0.4277 levels (fibonacci 0.382 level).
This is my opinion, I really hope it will be useful for you.
This is an article not financial advice, always do your own research.
And please don't forget to support this idea with your like and comment, It means a lot to me, thanks.
Be prepared and save your money. Make big profits!
Happy trading!

Coinbase to delist Bitcoin Stellar XLM from Coinbase Walletpast short setup
Coinbase to delist Bitcoin Cash (BCH), Ethereum Classic (ETC), XRP (XRP), and Stellar ( XLM ) from Coinbase Wallet!
My price targets:
XLM/USDT short
Entry Range: $0.085 - 0.090
Price Target 1: $0.079
Price Target 2: $0.0.071
Price Target 3: $0.069
Stop Loss: $0.111

XLM long-term viewXLM as been extremely bearish forever! However, I think the sleeping giants time has come and we will soon see a lambo pump!

two positions for xlmusdt ... check ithello guys i have 2 positions for xlm cryptocurrency...
short position:
sl: 0.1334
tp: 0.0590
entry: market
long position:
sl: 0.0341
tp2: 0.093
tp5:0.2067
entry: 0.0520
always do your own research.
If you have any questions, you can write it in comments below, and I will answer them.
And please don't forget to support this idea with your like and comment.

XLM - Technical review and analysisWe can expect these levels to become support with strong bullish candles only if we don't have a sharp drop in the market and buyer support is visible. Otherwise, with more selling pressure, we can expect a further decrease in this currency this week. It should be noted that the potential for positive divergence is observed on the RSI indicator. Therefore, after forming a positive divergence, we can expect price growth if the downward trend line is broken upwards in the 4-hour timeframe.

XLMUSDT Elliott Waves AnalysisHello friends.
Please support my work by clicking the LIKE button👍(If you liked). Also i will appreciate for ur activity. Thank you!
Everything on the chart.
growth from current price or through one more decline in zone 0.07 - 0.065$
I dont wanna miss trend that's why im already in pos and will buy more if we get one more decline.
Entry: market and lower (0.085 - 0.065)
Targets: 0.1 - 0.12 - 0.135 - 0.15
after first target reached move ur stop to breakeven
Stop: (depending of ur risk). ALWAYS follow ur RM .
risk is justified
Good luck everyone!
Follow me on TRADINGView, if you don't want to miss my next analysis or signals.
It's not financial advice.
Dont Forget, always make your own research before to trade my ideas!
Open to any questions and suggestions.

xlmusdtxlmusdt looks like in accumulation phase .we may be in manipulation phase after that we might see an expansion phase .
NFA DYOR

XLMUSDT | APPROACHING TO SUPPORTSTELLAR has been trading in a bearish trend .
The price has been making lower lows and lower highs.
Now after breaking some major support, price has approached to strong horizontal support zone .
The bulls can take control from here.
Manage your levels accordingly.

Stellar - XLMUSDT .. Buy The Dip Buy stellar on spot , add stellar if it dips ,add stellar when it rallies , hold stellar until 2026 ..


XLMUSDSTFormed Text Book Falling wedge in # Day timeframe
Rsi printed Bulish Divergence Too
expecting Massive bulish move Soon
Waiting For breakout

#Stellar Lumens Floats from $0.082, XLM under PressurePast Performance of Stellar Lumens
Stellar Lumens prices are steady at spot rates, moving tight inside a broader bear flag and technically bearish from a top-down preview. Even though there are flashes of strength, bulls must push above immediate resistance levels at $0.092 and later at $0.10 if XLM is to recover.
#Stellar Lumens Technical Analysis
XLM prices are inside a bear flag and bearish, trending in line with losses of early November 2022. Although the broader crypto market appears to be bouncing higher, XLM has support at around $0.082. While there are higher highs relative to the lower BB, prices are within a bear formation. Aggressive bears can unload on every attempt below $0.92 or November 9 high. However, any surge above this line will constitute a bull breakout formation, an opportunity for XLM buyers to load the dips, aiming for $0.10 or November 10 highs. Conversely, sharp losses below the immediate support may force XLM lower to $0.065 or Q3 2020 lows.
What to Expect from #XLM?
XLM is under significant pressure at spot rates, down over 90 percent from 2021 peaks. Accordingly, buyers must strive to push prices above the immediate liquidation levels and reverse November 9 losses for bulls to stand any chance of catalyzing demand.
Resistance level to watch out for: $0.092
Support level to watch out for: $0.082
Disclaimer: Opinions expressed are not investment advice. Do your research.

XLMUSDT Elliott Waves (Local Setup)Hello friends.
Please support my work by clicking the LIKE button👍(If you liked). Also i will appreciate for ur activity. Thank you!
Everything on the chart.
Entry: market and lower
Target: 0.095 - 0.102 - 0.105
after first target reached move ur stop in breakeven
Stop: ~0.083 (depending of ur risk). ALWAYS follow ur RM .
Risk/Reward: 1 to 4.5
risk is justified
Good luck everyone!
Follow me on TRADINGView, if you don't want to miss my next analysis or signals.
It's not financial advice.
Dont Forget, always make your own research before to trade my ideas!
Open to any questions and suggestions.

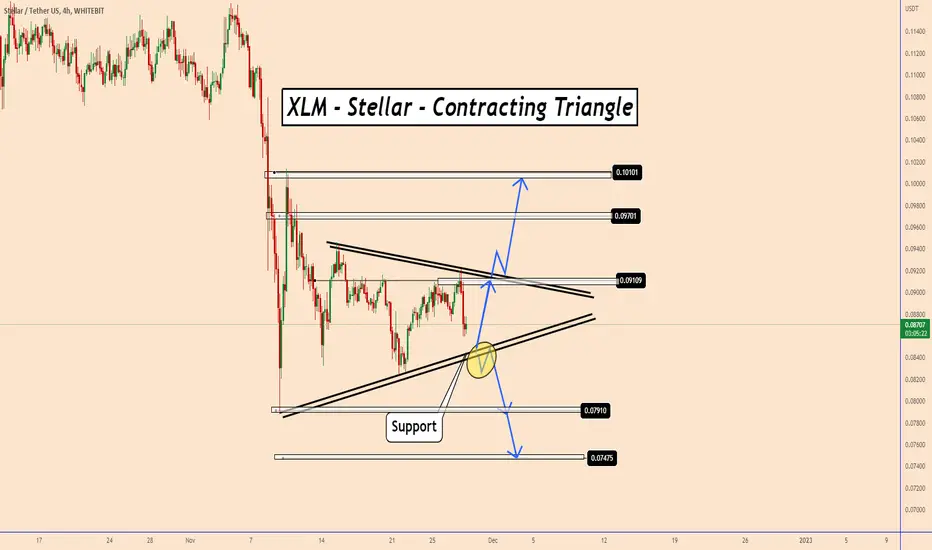
XLM | Stellar | Contracting TriangleXLM | Stellar | Contracting Triangle
Price is creating a contracting triangle and it has to decide where to move
next.
Actually it is testing the lower zone of the pattern and it can rise again
from that point.
If the price will manage to break down the triangle pattern it should move
down further
Targets on the chart!
Thank you and Good Luck!
Stellar reacted well to its monthly support level!Stellar reacted well to its monthly support level over the past week. After the price of this currency hit the support level of the previous floor due to the formation of positive divergence in the daily time, the price of this currency increased in the 1-hour time. The trend is bullish on the 1-hour time frame but not yet on the 4-hour time frame, and we can see the range area on the chart. Several resistance support ranges are considered on the chart.
The closest resistance that the current price is below this level is in the range of $0.090, which, if this level is broken with buying pressure, the next targets for buyers are in the range of $0.097 to $0.100. In general, due to the price of this currency in the above time frames, it has been placed on important support levels, and the possibility of its trend being ranged for several weeks is high. Price growth can be accompanied by a negative reaction after reaching the resistance of the $0.10 range, and further support levels can be tested.

XLMUSDT PROFIT POTENTIAL 487%Formed Falling Wedge in WEEKLY tf
incaase of breakout expecting minimum 4 to 5x
note always wait for confirmed breakout
