$XLM better than $XRP, half supply and better version. DYORWith $XLM's 50 billion supply, it's more reassuring than $XRP's 100 billion supply, and it's not owned by a company. Although both were developed by the same person, it shouldn't take long for people to realize that $XLM is a better version. I think $XLM has potential for so much more. It is not investment advice. It's my thoughts.
XLMUST trade ideas


XLMUSDTShort Idea for XLM 4 Hour
RSI has entered bearish control zone.
Wait for a possible retest of the range before going short.

XLM - AnalysisXLM experienced good price growth in the past weeks. After the price reacted positively in the support range of $0.098-$0.105 and broke out of its descending channel, the price pulled back to the ceiling of the broken descending channel, and from this range, we saw a 30% price growth. Although the power of buyers was greater than the power of sellers, the price hardly reached the resistance range of $0.130 to $0.135. Every time the resistances were broken, the selling pressure in the market increased, until an extreme reaction was observed in meeting this resistance, and in the following days, we saw a heavy 20% drop and pullback to the ceiling of the main descending channel.
All the resistance ranges that were considered on the chart are accompanied by a precise reaction and again from the support range of 0.107 to 0.178 dollars, we see the growth of the price of this currency. Also, the resistance of the $0.113 range has become a support, and the price can grow more after the complete exit from the large descending channel. An important resistance in the range of 0.146 to 0.160 dollars for this currency can be the first target of buyers.

XLM in Coming DaysXLM is in a Cup & Handle Right now Which means the Price will Be Increasing Soon. The Price will be Increasing as much as the Measured Price Movement ( AB=CD ) That means the Price will Reach around 0.1600$ Note: that we should wait for a break out to happen.
-XLM is in a Cup & Handle
-No break out
-( AB=CD )
-0.16$ is the Target
_ _ _ _ _ _ _ _ _ _ _ _ _ _ _ _ _ _ _ _ _ _ _ _ _ _ _ _ _ _ _ _ _
Thank you for seeing idea .
Have a nice day and Good luck

XLM/USDT follow through in price momentum.Possible continuation from a technical and chart stand point in the next coming weeks. Could hit TP at around December time.
I expect a follow through in the price movement to retest the 0.16 region and continue from there.
4hr RSI needs to cool off a bit before a push to the 0.13-0.14 region.
Macro in the markets is off. Could Crypto be resilient to this?
This is not financial advice.

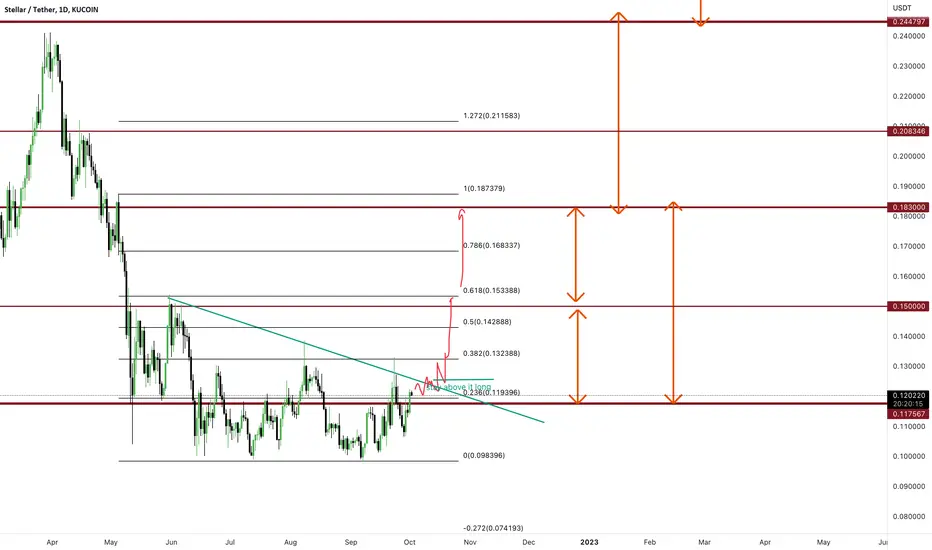
#XLM long once .125 is confirmed as support#XLM once trend line is broken n retested , we are looking for price to stay above .125 area if it does first target is .150/1.153 , once .153 is flipped we will aim for .183/.187
xlm shortin breaker area. I think its a good opportunity for sell short. I will try it from here. good luck.

Ichimoku Analysis XLMWill long $XLM if we get a daily closing above 0.1192 as there is a bullish kumo crossover.

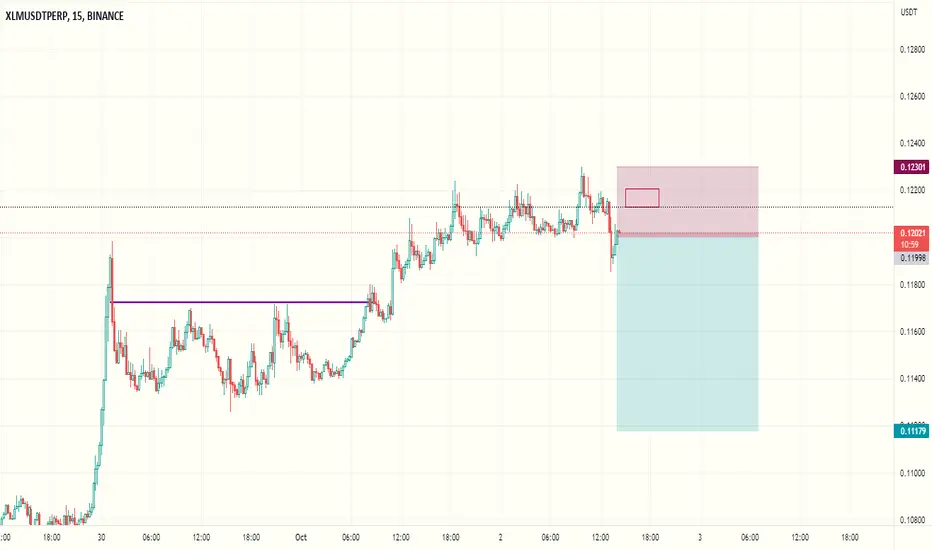
XLM LongLooking for the break above local resistance of .12
Once broken above, SL will be .118 and TP will be .127
Using 10x Leverage on Bybit

XLM/USD - Can XLM explode like XRP? YES! 😍XLM is lagging behind XRP in terms of price action. You can call it the little brother of XRP.
XRP consolidated in a similar channel and then broke out with a 50% pump.
I expect XLM to rally hard once it breaks this channel. The price action and volume show that buyers are interested.
My bias is bullish on this price action. Not sure why XRP and XLM are bullish in the current market conditions, but I am not here to judge, but rather to analyze the price action.
XLM looking quite decent here, but watch for a possible rejection again at the key resistance level.
Like and follow if you liked my idea!

XLM pumped 5%. What's next?Hello, dear TradingView members.
This is an XLM idea.
XLM moved 5% up and became one of today's top gainers.
The price now is on the local resistance level.
There are 3 support levels on the way down and only one solid resistance in the short-term scenario on the way up.
There are two scenarios in the current situation:
Scenario One:
The price will pass the local resistance and move to the solid resistance area and gets rejected and falls back on the local resistance and turns it into support.
Scenario Two:
The price will get rejected by local resistance and fall back to the half-shadow support levels.
RSI is in the overbought area, and the price has more room to go down.
Now let's see your ideas. Let's have a discussion.
Let me know if you guys have any questions;
I will be more than happy to help.
Good luck, and thank you.

XLMUSDT - Long with strong Up Volume- The Up volume > Average (20)
- Look back:
... The short key level was broken with a strong Up volume (x4).
... Corrective zone is with a down volume lower than Average 20 candles.

XLMUSDT - 4H - Bullish BatAfter a strong decline we can expect a bounce near 0.1050
Entry = 0.1050
Target 1= 0.1135
Target 2= 0.1209
Stop loss= 0.1007
Happy trading to all!
If you like this idea please like and share.
Best Regards.

XLM Moments Before Krypton | Need to Break 11-13 CentsXLM What a great project. Lots of consolidation done, very good girl stellar.

#XLM Projected TargetXRP have been having all the fun lately but what about Steller? In my view a positive outcome for XRP will also be positive for XLM. Both are competing for the same space at the moment.

Stellar (XLM) formed bullish Gartley for upto 12.50% moveHi dear members, hope you are well and welcome to the new trade setup of XLM .
Previously I shared a long-term trade setup for XLM , which is still in play:
Now on a 4-hr time frame, XLM has almost completed a bullish Gartley pattern. There is also a hidden bullish divergence, as the priceline is forming a higher low and Stochastic is setting a lower low.
Note: Above idea is for educational purpose only. It is advised to diversify and strictly follow the stop loss, and don't get stuck with trade

XLM Can Start to Increase soonXLM is in a Rounded Bottom Right now Which means the Price will Be Increasing Soon. The Price will be Increasing as much as the Measured Price Movement (AB=CD) That means the Price will Reach around 0.1600$. 27% Profit (at least !) Note that we should wait for a break out to happen.
-XLM is in a rounded Bottom
-No break out
-(AB=CD)
-0.16$ is the Target
-27% Profit
_ _ _ _ _ _ _ _ _ _ _ _ _ _ _ _ _ _ _ _ _ _ _ _ _ _ _ _ _ _ _ _ _
Thank you for seeing idea .
Have a nice day and Good luck

Stellar XLM Bearish SentimentFriday the S&P reached its 52 week low, $3636. There is a strong correlation between the S&P and the crypto world. Many stock investors diversified their portfolio into cryptos, especially in BTC Bitcoin and ETH Ethereum .
With a bearish stock market in the worst month for stocks and cryptos, i expect most of the cryptocurrencies to trade lower this week.
XLM/USDT short
Entry Range: $0.110 - 120
Price Target 1: $0.098
Price Target 2: $0.0.092
Price Target 3: $0.080
Stop Loss: $0.129

XLM Needs to Break 13 Cents USDA break back over yesterdays high will be the pump we've been waiting for. WHALES BUY

XLMUSDTHello Crypto Lovers,
Mars Signals team wishes you high profits.
This is a one-day-time frame analysis for XLMUSDT
In the current chart, there are R2 and R1 as our resistance areas which both contain the disability of the price to rise. And at the bottom, we have S1 that is a support area and the well support of price since the past is obvious in it. Thus, we have the fluctuation of price below R1 area and we believe it will have a decline toward S1 and there we should have some rising signs in order to make sure the price will rise to higher amounts. Clearly, the price has a neutral behavior at the present between R1 and S1 and we cannot define a precise position for it unless it leaves this area. Let's wait and see what future reveals.
Warning: This is just a suggestion and we do not guarantee profits. We advise you to analyze the chart before opening any positions.
Wish you luck

