XLMUSDT - Short by Supertrend 8/27/2022- 4h timeframe: Supertrend indicator > Short.
- 1h timeframe: Wait a correction (Long) and breakout long for short to open a Sell follow 4h timeframe.
... Long correction (Supertrend 1h)
...Long correction be broken:
* Author trades real at Binance Future.
XLMUST trade ideas


XLM/USDT Alts looking primed for an intraday Long Whats Up Retail Whales 🐋
Before we start to discuss, id be so glad if you share your opinion on this post's comment section and hit the like button if you gained value!
#XLM has pulled back into our 1Hr Whale Block here and we will monitor for a trade entry with confirmations.
A lot of the Alts are falling into this same setup so be manage your risk management, only ever have 5% of your portfolio active at any one time, especially with correlated Alts trades.
I will be looking for a 15Min/5Min RSI Divergence along with a potential VSA Divergence.
Remember we are trading human emotions and probabilities
Hope you enjoy the content we create, You can support us with your likes and cheers 🙏🙏
❗️Attention: this isn't financial advice we are just trying to help people with their vision.
HooRaa

XLMUSDT Bullish setupBINANCE:XLMUSDT
first wait for last bearish trend after that may we can buy it maybe this good!

Xlm long position for day tradingif the Xlm holds the 12 cents support, it can move up to 13 cents. 7 percent for a non leverage trade.

Can #XLM stellar be the coin of the week? #BullishStellar pulled back to 100 ma and can be at an ideal place to high rocket in 1 to 2 days (of course with the help of #BTC)
TP: .137 $
SL: .115 $

XLMUSDT Long📈Previous important support and resistance zones:
***s1: 0.1356
***r1: 0.1240
***r2: 0.1356
**r3: 0.1206
Conditions for Long:
1.Symmetrical triangle breakout
2.trendline breakout
3.momentum indicator trendline breakout
4.support from previous resistance ***r2 zone
6.Money flow index turned green from red
7.volatility has increased
8.di+ is above the di-
9.adx line is above the 20 level
Stoploss:
1.below the previous resistance zones of ***r2
Take profit:
1.take profit is dynamic,trailing stop loss/take profit
Exit point:
1.will be updated later in the comments box only if someone asks

#XLM/USDT(SWING TRADE)
There a breakout of downward trend
MACD is showing bullish EMAs showing a bullish move RSI is neutral
targets set at the chart

XLMUSDT 1W Complete trading history for 8 years and what next?Before you is the longest trading history of XLMUSDT
Someone may think that this review is timed to the hype news that Robinhood can be listing XLM on its site.
But no, this review is timed to the 8th anniversary of the trading of the XLMUSD pair.
It was at the beginning of August 2014 trading of the XLMUSD pair started, or on some crypto exchanges they marked STRUSD (only those who have been on the crypto market for many years know about this, now you know too :)
Now many users are expecting a shot of the XLM price
But we would be careful with expectations of super growth, because the reality may be different.
Yes, now the XLMUSDT price can break up to $0.165-0.17. Further, adjust to $0.12 and if the price is firmly fixed above $0.12 - then strong long. But you have to understand that it can be a long-term investment.
But you have to be careful, it's more about us, because the chance that the XLMUSDT price can still fall to $0.075 is quite high, and buying there would be a very profitable deal.
Summarizing:
- If you have already bought Stellar, then you can expect growth to $0.17, maximum to $0.2 and further correction. Also keep a short stop on the position.
- Safe entry into the long XLMUSDT position after fixing the price above $0.12. Growth targets are $0.2 and $0.35
- A very conservative entry into the position is to place a buy order XLMUSDT at $0.075 and wait for a lucky price spill
_______________________________
Since 2016, we have been analyzing and trading the cryptocurrency market.
We transform our knowledge, trading moods and experience into ideas. Each "like under the idea" boosts the level of our happiness by 0.05%. If we help you to be calmer and richer — help us to be happier :)


XLM/USDT 4H chartXLM/USDT 4H chart
wait for pullback till 0.108 dollar and wait for rejection then it can continue his but run

XLM/USDTXLM/USDT
It is located in a descending channel that has broken its internal downward trend line and returned to it again.
It is expected that in case of support in this area, the price will increase up to 17 cents.
#XLMUSDT #XLM #BTCUSDT #BTC #ETHUSDT #DOGE #DOGEUSDT

what do you think about my position???hello guys
i got this position last few days ago, and free risk it now but i have a long tp zone about 0.085
what do you think about my reward zone? it is too much?

XLMUSDT Short-term upward movementHello guys
This currency has stop-hunt that level and confirmed a possibility of a short upward movement to the bearish trend line, but as you can see in the weekly timeframe image, it needs to downward to the price range of 5.7-8.5 cents, and that area has potential to start the growth of this currency.
In the future, this analysis will be updated.
follow me please and like this post.
thanks for your attention!

Stellar XLM short Entry Range, Take Profits and Stop LossXLM/USDT short
Entry Range: $0.110 - 120
Price Target 1: $0.098
Price Target 2: $0.0.092
Price Target 3: $0.080
Stop Loss: $0.129
previews short

XLMUSDT Long📈Previous important support and resistance zones:
***r1: 0.1110
**r2: 0.1161
*r3: 0.1206
Conditions for Long:
1. Symmetrical triangle breakout
2.trendline breakout
3.momentum indicator trendline breakout
4.support from previous resistance ***r1 zone
6.Money flow index turned green from red
7.volatility has increased
8.di- is above the di+
9.adx line is above the 20 level
Stoploss:
1.below the previous resistance zones of ***r1:0.1110
2.when price makes higher high but there is a divergence in momentum indicator put your Stoploss below the entry price
Take profit:
1.take profit is dynamic or trailing stop loss
Exit point:
1.will not be updated later in the comments box

XLMUSDT
This is an article, not financial advice, always do your own research.
If you have any questions, you can write it in comments below, and I will answer them.
And please don't forget to support this idea with your like and comment, thank you.

XLMUSDT UPDATEXLM is looking beautiful here for the rollover, although we have seen the rally across the board on crypto- The market structure is still bearish. We can see the LH and LL formation is very much valid.
From a 4H perspective price previously made a BOS and formed a new LL this move has been followed by a retracement which is currently consolidating below the 0.786 fib resistance, we are monitoring PA on the LTF for potential short entry confirmations.

Stellar Bulls Surging, XLM Prices May Retest $0.13Past Performance of Stellar Lumens
Stellar Lumens prices are rallying and syncing with the broader market. The coin is stable on the last trading day but trending above a multi-month resistance trend line traced to April 2022. As the XLM prices bottom up, traders may find opportunities to ramp up in lower time frames.
#Stellar Lumens Technical Analysis
XLM prices plunged 88 percent after peaking at $0.75 in May 2021. Currently, the coin is up 16 percent from 2022 lows, and buyers are in control, reading from the candlestick arrangement in the daily chart. As price action takes shape to favor buyers and prices break higher above the critical resistance level, traders may search for entries on dips, targeting $0.13 in the medium term. This preview, however, is only valid if prices are steady above $0.10. Any breach below this reaction point may force XLM towards $0.09 or worse in a bear continuation formation.
What to Expect from #XLM?
The bounce to spot rates is refreshing for token holders and may find the base for another leg up towards $0.17 and Q1 2022 lows. Still, the rapidity of the uptrend will highly depend on if there is confirmation of July 18 gains and the level of trader participation. Any expansion in trading volumes with rising prices could signal strength and buyers taking charge after months of lower lows.
Resistance level to watch out for: $0.13
Support level to watch out for: $0.10
Disclaimer: Opinions expressed are not investment advice. Do your research.


XLM Trade SetupMarket has been green over the past three days ! so good to see these kind of rallies after a long time.
Moving to the XLM chart ! here's the thing, the pattern you are looking in the above chart is known as cup and handle pattern. As we all know BTC had broken
it's range high in which it had been traded from the past 28 days, adding to this XLM had broken this cup and handle pattern and coming back to retest the breakout area.
Here's what i think, my final target calling is 11% up from hereon therefore target price falls under $0.119 to $0.123, when can you enter the trade? Ofc you can enter right now as it is trading at the local support but one thing to keep in mind is observe the volume if not you can wait for it to come towards the breakout zone, but make decisions accordingly and also not to mention that my stoploss is below the breakout area, i hope you know trade management so that if the breakout fails you can cut your losses.
Note : Anything provided here is not a financial advice, trade upon your own risk.

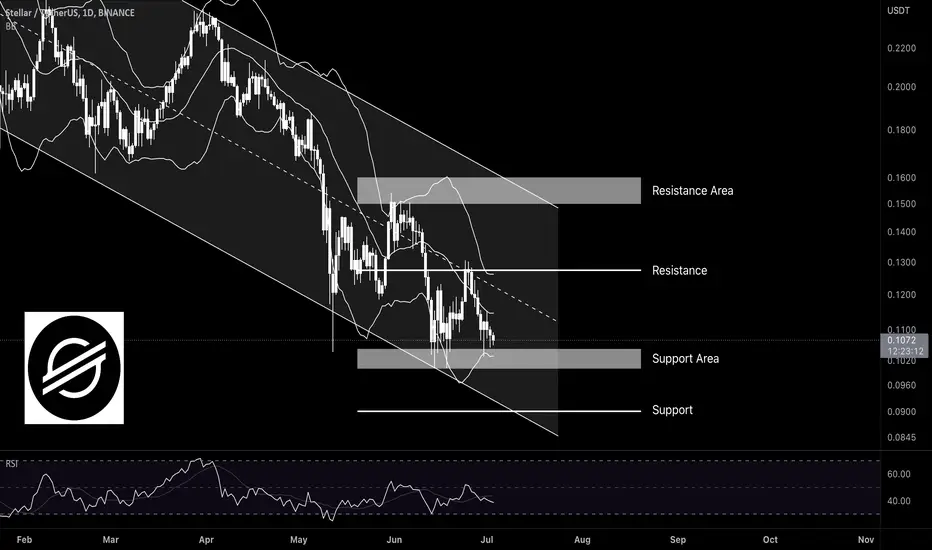
The direction of price movement will be towards lower support!Hello to all members of TradingView and my followers.
XLM experienced a price drop last week. Since the main trend in the daily time frame is bearish, the price has negatively reacted to the resistance range of 0.12 to 0.13 dollars. On the other hand, the downward movement and selling pressure has brought the price to the previous floor. Therefore, if the reaction to the support range of 0.100 to 0.105 dollars is observed, we expect to see the return of the price and the continuation of the range trend in the range of the current support and resistance of 0.15 to 0.16 dollars.
Also, if we see another drop in the market, the price will be expected to hit the support floor of the $0.087 range. For this month, as long as the price is below the $0.12 level, the direction of price movement will be towards lower support.
If it is helpful to you, please like it. If you have a comment, I'll be happy to know. Respectfully.
XLM has continued its range trend in the support rangeHello to all members of TradingView and my followers.
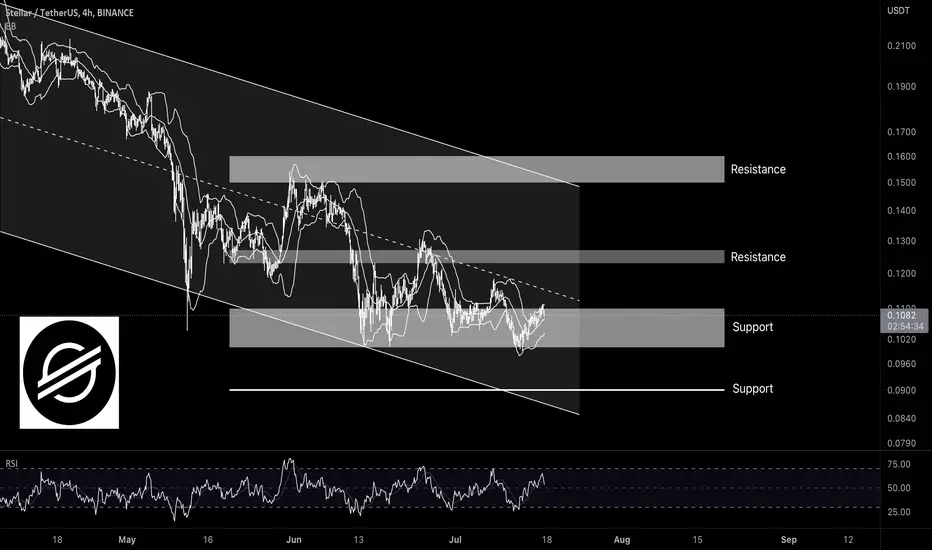
During the last week, XLM has continued its range trend in the support range of $0.11 to $0.10. The price is still in an overall downtrend, and even the midline of the descending channel is still acting as resistance. Unlike other currencies in the market, Stellar made a lower bottom again last week. Still, the previous bottoms were temporarily broken, and the candles returned above this support area. The 4-hour time frame shows that the resistance drawn on the chart is in the range of $0.123 to $0.127 until it becomes support. In the best case, if the support of $0.10 is maintained, the range trend can continue.
If it is helpful to you, please like it. If you have a comment, I'll be happy to know. Respectfully.