XLM Crashes Below Key Support – Is a Reversal Near?XLM has broken its previous low, raising the question: where is the next major support zone? To determine this, we will focus on fibonacci, moving averages, and order blocks to find a high-probability bounce area for a potential long position.
🔍 Fibonacci Retracement – Locating the Next Support Level
Using the Fibonacci retracement tool from the low at $0.0757 to the high at $0.6374:
0.618 Fib Retracement → $0.2903 (Already Lost) ❌ Current Price: $0.248
Next Major Fib Level – 0.786 Retracement at $0.1959
Since the 0.786 Fib level is a key retracement point, we need further confluence factors to confirm its strength as a potential support zone.
🔗 Confluence Factors Strengthening the Support Zone ($0.1959 – $0.17179)
1:1 Trend-Based Fibonacci Extension
High: $0.6374
A: $0.3179
B: $0.515
1:1 extension aligns at $0.1902 → Strong confirmation near 0.786 Fib retracement ✅
Wave A-B Fibonacci Extension
1.618 Fib extension from wave A to B is at $0.1875 → Aligns with the 1:1 trend-based extension ✅
Daily Support Level at $0.1962
Sits almost exactly at the 0.786 retracement ($0.1959) ✅
21 EMA & 21 SMA for Moving Average Support
21 EMA at $0.20338
21 SMA at $0.17187
Order Block Between $0.2208 – $0.1964
Demand area aligns with the major support zone ✅
Key Takeaway:
A high-probability support zone is now identified between $0.1959 and $0.17179, with multiple confluences suggesting a strong potential bounce.
Trade Plan – Scaling Into a Long Position
Given the strong confluence at the support zone, the best approach is scaling into a long trade.
DCA Entry Strategy:
Start scaling in at $0.22, as an order block exists between $0.2208 – $0.1964
Main focus remains on the support zone ($0.1959 – $0.17179)
Stop Loss:
Below the 21 SMA ($0.17187) for invalidation
Take Profit Levels for Optimal R:R:
First TP at $0.25 → Resistance area
Next TP at $0.30 → Strong psychological & resistance level
R:R Approximation:
2:1 R:R for first TP ($0.25)
3:1+ R:R if targeting $0.30
High-Probability Support Zone Identified
✔ Multiple confluences confirm a strong support zone at $0.1959 – $0.17179
✔ Scaling into a long from $0.22 to $0.17179, with stop loss below the 21 SMA ($0.17187)
✔ Take profit levels set at $0.25 & $0.30 for a solid R:R trade
Alternative bullish scenario: A reclaim of lost key low at $2526 with rising volume could signal a long opportunity, only on confirmation.
💬 Will XLM bounce from this key support? Let me know your thoughts in the comments! 🚀🔥
XLMUST trade ideas

XLM/USDT(BUY)hello friends
According to the formation of a QM model, it is possible to enter into a transaction with risk and capital management.
*Trade safely with us*

XLMUSDT Weekly LONG This is a weekly technical analysis for educational purposes on XLMUSDT. I believe that Stellar will find new higher high levels in the middle of the 2025 Bull Season.
As I mentioned before on my ALGOUSDT Weekly Analysis ;
"Considering the global economic crisis, the technical recession in the United States, the suppression of gold and other commodities, the real estate and unemployment crisis in China, and the European Union countries' struggle with inflation, I believe that market makers (the bulls) may create a false FOMO (Fear of Missing Out) during the 2024 BTC halving period, potentially driving BTC to levels of perhaps 50K+ before ending the year 2024 around the 20-25K range. When we consider the global effects, the real bull season is likely to occur between 2025 and 2026.
Reaching 100K in Bitcoin by 2024 wouldn't make much sense if most people don't have the financial means. It's important to remember that patient wealthy individuals often capitalize on the impatience of those with fewer resources. (let's say poors with high dreams) Those with limited means may not have the capital to participate in the market for couple of years.
This is not "clever riches profit from the idiot riches game". Never was. I believe.
I may be wrong, :)
Regards,

TradeCityPro | XLM: Key Levels and Market Analysis👋 Welcome to TradeCity Pro!
In this analysis, I want to review XLM for you. This coin is one of the U.S.-based crypto projects, and given the recent surge in news regarding crypto and the U.S., it could experience significant volatility, making it suitable for trading.
📅 Daily Timeframe
On the daily timeframe, we can see a strong bullish leg that extended up to $0.5781 before entering a correction phase, forming a descending wedge.
🔍 At the moment, there is a very important support level close to the price. If $0.2827 is broken, we can expect a further correction toward the 0.5 or 0.618 Fibonacci retracement levels. Another key support level is at $0.1566.
⚡️ The $0.2827 zone is highly significant, as it overlaps with the 0.382 Fibonacci retracement, making it a crucial level. If the price finds support at this zone, we could see the next bullish leg begin. However, if this support is lost, the price could experience sharp downward movements.
🔼 For spot buying, the $0.3522 resistance has turned into a solid level, where the price has tested and rejected multiple times. If the wedge pattern and resistance break, you can enter a long position or consider spot buying.
🚀 The next resistance levels are $0.4896 and $0.5781. The ATH at $0.7791 is a major supply zone.
📊 In the next few days, pay close attention to volume. A rise in volume before a breakout could indicate an imminent move.
⏳ 4-Hour Timeframe
On the 4-hour timeframe, we can observe price action in more detail. There is strong resistance at $0.3522, where the price was rejected, leading to significant bearish momentum.
✅ Currently, the price is reacting to the $0.2817 zone, and after seven consecutive red candles, a green candle has formed. Previously, the price faked a breakout at this level, and now it has retested this zone again.
🔽 If $0.2817 is broken, a short position can be opened, with the next support at $0.2368. For long positions, wait until the price forms a structure and the $0.3102 trigger level is confirmed. The main long trigger will be a breakout above $0.3522.
📝 Final Thoughts
This analysis reflects our opinions and is not financial advice.
Share your thoughts in the comments, and don’t forget to share this analysis with your friends! ❤️

XLM Buy/Long Setup (12H)After heavy drops, it is approaching a key support level.
It is expected to bounce upward upon hitting this support.
A daily candle closing below the invalidation level will invalidate this analysis.
Let’s see what happens.
Do not enter the position without capital management and stop setting
Comment if you have any questions
thank you

XLM update#XLM has a nice pattern of descending wedge which is a bullish signal i think that this coin can make a big rise as it hit the demand zone but in another hand the whole pattern has still its bearish structure !
Trading Genius Reveals How To Succeed In 2025 (Must Watch!)Let me explain. The market won't start growing in a matter of days. It is true that long-term support has been hit, activated, but the next bullish wave will take time to develop. Between each wave, there is always a period of sideways, consolidation.
It is the first time that MA200 is tested as support coming off a major high —since September 2023. XLMUSDT daily.
Now, a period of sideways action will start (consolidation), after this period is over we will experience massive growth. Sideways is sideways, just so you know. This period can last anywhere between 1-3 months. The action will vary between pairs, some will move first while others will take longer.
Patience is key.
Start accumulating and whatever you do, focus on the long-term.
The waiting can be boring and troublesome for a few, this will be your test. If you try to move from pair to pair trying to catch the next bullish wave, you will fail. The exchanges will only buy those pairs that nobody is buying to create the illusion of massive growth. The truth is that most of the market will be sideways and the gamblers will be getting whipsawed. That's how it all works.
When you see a pair growing 600% in a single day, just know that nobody is holding it other than the exchange. It is an illusion. To succeed, create and follow a strategy, focus on the long-term.
Any easy and quick money mentality will result in a great opportunity being lost. It will be hard to lose in a bull-market, but you can lose by ending up with 2-3X "trading" when you can end up with 10-20X with a simple strategy of buy and hold.
Namaste.

@XLMUSDT still in its bearish trend@XLMUSDT is still in the downtrend. It is in wave C correction wave. The target price is indicated in the chart.
Trading pullish is a counter trend trade. so you have to reduce the volume.
Trading bearish is better but use a tighter stoploss not to get hurted.
Goodluck

XLMUSD - SHORT SETUPCoin: #XLM/USDT
Short Set-Up
Leverage: 5-10x
#XLM already breaked down the symmetrical triangle and looking bearish.
Entry: 0.278 - 0.284$(Enter partially)
Targets: 0.272 - 0.266 - 0.260 - 0.254 - 0.242 - 0.230$(Short term)
Stop-loss: 0.290$
Please support with a like/boost and follow for more useful crypto updates!

XLMUSDTWe can attempt to buy XLMUSDT from specified level as it make HL , also there is no bearish divergence occur indicate that it moves upward.
SL , TP mention in chart.

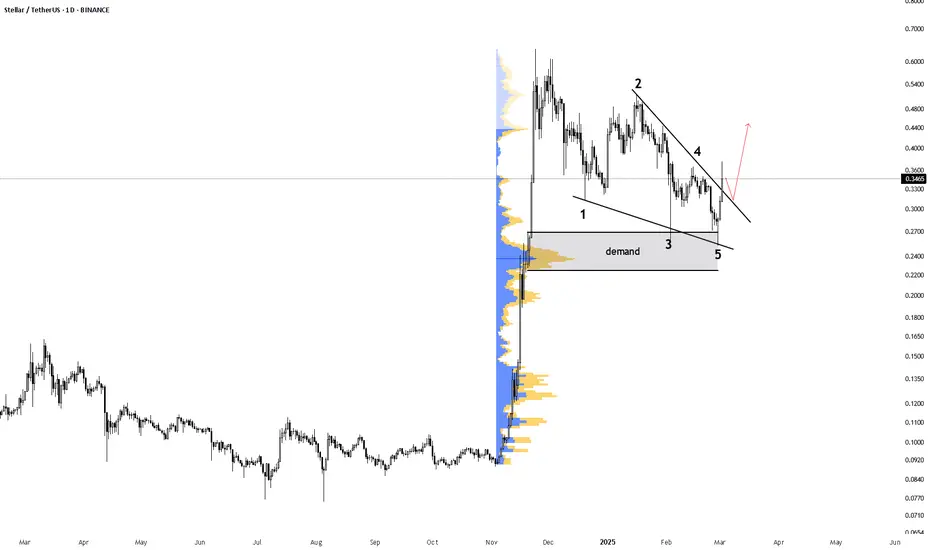
Lingrid | XLMUSDT triangle PATTERN. Breakout on the HORIZONBINANCE:XLMUSDT market is forming a triangle pattern, indicating a consolidation phase. However, the price dipped below the December and January lows, testing the psychological level at 0.3000 before bouncing back. Since the price has been trading above the upward trendline for the past three weeks, I think it may continue to bounce off this line. I expect the price to move toward the next key resistance level around 0.4000. My goals is resistance zone around 0.3500
Traders, if you liked this idea or if you have your own opinion about it, write in the comments. I will be glad 👩💻

XLM update#XLM made a good correction after its huge rising move !
the market made a good correction too it touched the demand zone
the correction pattern was ABC and this coin has a good long term pattern too
check out my last analysis on this coin

XLM may bounce here #XLM #stellar is now sitting on a major support zone (red box) and may likely have a bounce here for short term movement.

XLMUSDT: 87% Fast Move Potential Towards IRL/ERL Target!🚀 XLMUSDT: 87% Fast Move Potential Towards IRL/ERL Target!
🧐 Analysis:
Expecting an 87% Move 📈🔥
Monthly IRL/ERL Target – Strong Zone for Expansion 🎯
Fast Move Expected – Price could accelerate quickly once it breaks key levels 🚀💨
🎯 Plan: Watch for entry signals, the move could be quick and powerful! 🏃♂️💥

XLMUSDT 1DXLM ~ 1D Analysis
#XLM The Bullish flag was formed on the 1D time frame. Buy gradually in this support block with a minimum target of 10%++.

XLM - Targets and Bull Flagbull flag printed on XLM, Uber bullish, TP are displayed, can go parabolic and copy XRP

XLM will have a decision#stellar #xlm price is now testing a major resistance zone, now. This zone is also the bearish retest zone of where CRYPTOCAP:XLM broke the support. So, this retest will be very important.

Stellar 2021 High Energy Fractal: Where Is The 2025 ATH?The huge bullish wave in late 2024 might seen like a lot, specially when we consider the fact that Stellar (XLMUSDT) hit close to its previous All-Time High, but this is not true. The growth wave was great and we appreciate the Cryptocurrency market growing and evolving, this is something that we can all agree with. What is not good and we disagree is the conclusion that the wave is over and that no more growth is possible. Actually, this is only the beginning. You've seen nothing yet.
Stellar is in the "first wave" of a major bull-market based on this high energy fractal. If you use the long-term linear chart you can see the similarities between the previous wave, late 2024 and the "first wave" of late 2020. Identical and four years apart.
Stellar went on to produce another massive wave in 2021.
Present day, Stellar will go ahead and produce another massive wave in 2025. The big difference is how the chart was setup back then. In the previous cycle, Stellar came out of a major v shaped bottom and started to grow. Present time, we have a long-term sideways accumulation phase. This phase will lead to massive growth; the longer the accumulation phase, the stronger the bullish wave that follows, that's for sure.
There is room for maximum growth. There is room for much more growth and the chart agrees. Market fundamentals agree, geopolitics agree and the world agrees.
Buy and hold XLMUSDT if you want to win.
For great chart and technical analysis, just follow me.
Namaste.

Stellar Coin (XLM): Possible Breakdown From Bullish ChannelStellar Coins seems like it might break the bullish channel during the weekends.
We see the selling pressure that is happening currently so we are waiting for further confirmations where sellers need to take full control over 200EMA, which then would result in a move to that yellowish zone.
Now if we see any signs of buying volume near the current zone and we form a BoS on smaller timeframes near $0.4475, then we will most probably continue the movement in the bullish channel, but for now this is just a future possible scenario; markets are still too weak for now!
Swallow Team

XLM does not look bad#xlm CRYPTOCAP:XLM chart is moving in the support zone and may have bounce due to market conditions. #stellar is important for being #xrp 's cousin. Not financial advice.

Mid term target for XLMXLM just finished it's ABC correction after a beautiful Elliot impulse wave (12345). Using Fibonacci extension my mid to long term target is 0.8157 dollar. What are you guys thoughts?

XLM (STELLAR) is dropping to 0.19 - EAT THE FEETCRYPTO:XLMUSD
Whats the name of Michin’s finishing maneuver?
“Eat Defeat” or “Eat The Feet”?
Well! who cares its the same… Potato Patato…
Anyways I was saying:
DO NOT BUY XLM
Its gradual bearish trajectory has started.
Blow ME a kiss &
Thank ME later with a gift 🎁
Crypto Chief Signing Out

XLM update#XLM is making a big correction wave there is a nice demand which can make the market rise a bit as wave B but we have to wait for the market to see what will happen
