XLMUSDT BEARISHLike other coins at the moment, I believe XLMUSDT will experience a slight bullish movement followed by a bearish one. The targets are marked for take profits (TP) and correction points. The danger zone is to help you stay cautious with your positions, while the stop loss is to signal that the trade setup has failed.
Note 1: Pay close attention to the danger zone and stop loss levels. If the close crosses these levels, the analysis will either be in danger or invalidated.
Note: My ideas are not intended for any type of scalping or scalpers!
You can find the full list of my ideas here: www.tradingview.com
Here are some of my ideas:
XLMUST trade ideas

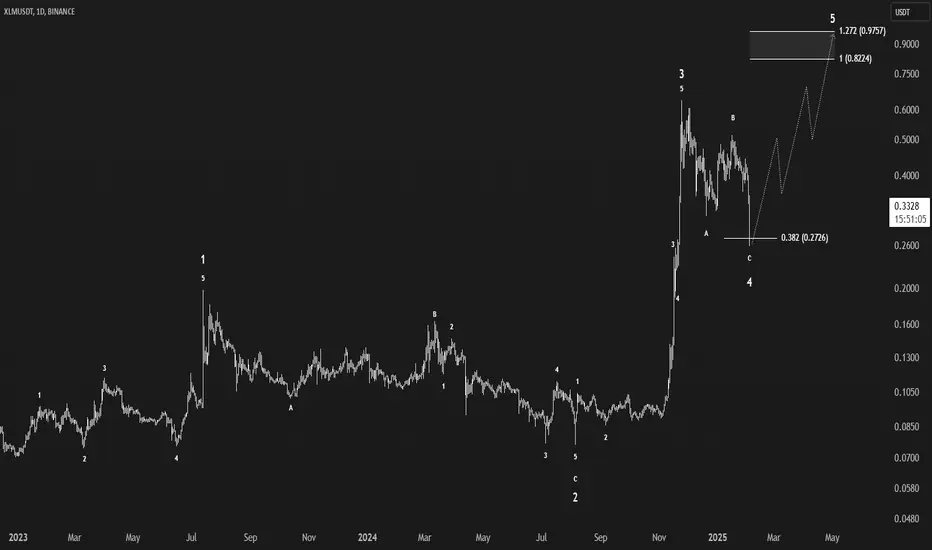
XLM/USDTWave C of 4 completed, get ready for wave 5. Altcoin season is closer than your jugular vein.
XLM Long following XRP StructureChart Comparison: XLM vs. XRP
On the left side of the chart, we have XLM/USDT, and on the right, we're comparing it with XRP/USDT. Both charts display a very similar structural pattern, with XRP showing a more advanced movement compared to XLM. It appears that XLM is currently lagging behind XRP but is likely to follow suit soon.
Given the similarity in price action and market behavior, I anticipate XLM will catch up, and I am expecting a move towards the marked target in the near future. If XLM continues to follow XRP's trajectory, we should see an upward move that aligns with the target zone.
Keep an eye on XLM for a potential breakout and move towards the target area marked in the chart.

XLM Going sidewaysAfter the down trend got a bit out of shape i can see XLM bouncing sideways for the time being.
After that its anyones guess but, I'm bias Long.

Trendline Liquidity Grabbing – Smart Money Tactics!🚀 What Just Happened?
A trendline was respected multiple times, creating a strong support level. However, instead of bouncing immediately, price broke below the trendline, grabbing liquidity before reversing with strong momentum!
🔍 Why Does This Happen?
📌 Retail Trap: Many traders place buy orders at the trendline and stop losses just below. Smart money hunts these stops to accumulate liquidity.
📌 Fake Breakout: The price temporarily dips below to trigger stop losses & weak hands before the real move begins.
📌 Confirmation Reversal: After liquidity is taken, strong buying pressure pushes the price back up!
📊 Lesson for Traders:
✅ Don't panic when a trendline breaks—watch for liquidity grabs!
✅ Wait for confirmation before entering trades.
✅ Use this as a sniper entry strategy for high RR trades.
🔥 Master this, and you'll stop falling for fake breakouts! 💰

XLMUSDT analysis and predictionStellar is a blockchain-based platform designed to facilitate fast, low-cost, and cross-border payments. It was launched in 2014 by Jed McCaleb (co-founder of Ripple) and the Stellar Development Foundation (SDF). The native cryptocurrency of the Stellar network is XLM (Lumens), which serves as a bridge currency for transactions.
#CryptoNews
#CryptoViral
#ToTheMoon
#HODL
#WAGMI
#CryptoGains
#WhenLambo
#CryptoCommunity
### **1. What is Stellar?**
- Blockchain platform for **fast, low-cost, cross-border payments**.
- Native token: **XLM (Lumens)**.
### **2. Key Features**
- **Speed**: 1,000–5,000 transactions per second.
- **Low Fees**: Fractions of a cent per transaction.
- **Energy Efficiency**: Uses Stellar Consensus Protocol (SCP), not PoW/PoS.
### **3. Use Cases**
- **Cross-border payments** (e.g., remittances).
- **Tokenization** of assets (e.g., stablecoins like USDC).
- **Micropayments** and **decentralized exchanges (DEX)**.
### **4. Partnerships**
- **MoneyGram**: For global remittances.
- **Circle**: USDC stablecoin on Stellar.
- **IBM World Wire**: Blockchain-based payment system.
### **5. Competitive Edge**
- Focus on **financial inclusion** (unbanked/underbanked).
- **Interoperability** with traditional financial systems.
### **6. Challenges**
- **Competition**: Ripple (XRP), Solana, Algorand.
- **Regulatory risks**.
- **Limited smart contract functionality**.
### **7. Future Potential**
- Growth in **CBDCs** and institutional adoption.
- Expansion of **real-world use cases**.
Stellar is a **utility-driven project** with strong fundamentals but faces competition and regulatory hurdles. Always DYOR before investing!

XLMUSDT BEARISHXLM performed as I expected before. Is it possible for it to do so again?
Note: My ideas are not intended for any type of scalping or scalpers!
Here are SOME of my ideas:
Full list of my ideas are here:
www.tradingview.com

XLMDid great indeed but to all things that reach the top; what goes up, must come down…always use SL and manage your account responsibly. Always always always take profit!

XLMUSDT → Attempt to change the local trendBINANCE:XLMUSDT is entering the correction phase after attempting to forge an uptrend. Price is breaking support due to the change in market nastreonium and bitcoin correction.
Bitcoin is moving into a correction, which is generally creating pressure for the already weak altcoin market. The reason is disappointment from the cryptocurrency community due to the lack of hints about cryptocurrencies in the new President Trump's speech. The market is trying to digest this fact as part of a correction.
XLM is technically breaking the ascending support inside the global descending channel, meaning that the pressure on the market from the bears is still present.
Support levels: 0.4177, 0.3896
Resistance levels: 0.460, 0.4955
The focus is on the previously broken channel boundary and the support level at 0.4177. The price may still test the previously broken channel boundary before falling further. But, a breakdown and consolidation of the price below 0.4177 may provoke sales.
Regards R. Linda!

XLM - Will XLM Find Strength or Stumble?XLM has been in a downtrend for the past 10 days after rejecting from the 0.618 Fibonacci retracement resistance. The price action shows lower highs and lower lows with no significant volume, signaling a potential continuation of the trend. Let’s identify the key support and resistance zones and possible trade setups.
Support Zone
A strong support zone lies between $0.3725 and $0.3695 based on multiple confluences:
Monthly Level: At $0.3725
Anchored VWAP: From the very low, the VWAP aligns with the monthly level
Fibonacci Retracement: Drawing the fib retracement from the year’s low to the recent high, the 0.75 Fibonacci level lies at $0.3695
Resistance Zone
Key Level: Price data highlights $0.435 as a significant S/R zone
Fibonacci Retracement: The 0.618 Fibonacci retracement from the current wave aligns with the key level
Short Trade Setup
Entry: 0.618 Fibonacci retracement/key level at around $0.435
Stop Loss: Above the previous high
Take Profit: Target the support zone at round $0.3725
Risk-to-Reward (R:R): 4.5
Long Trade Setup (on confirmation)
Entry: Long position between the support zone of $0.3725 and $0.3695
Stop Loss: 3% SL
Take Profit: around 0.39/0.4
Risk-to-Reward (R:R): 2 or better

XLM is preparing for its next leg u
#XLM Accumulating in the Key Support Zone near $0.4013, aligning with the 0.618 Fibonacci level
A breakout above $0.5243 could initiate a strong bullish move!
🎯 Target 1: $0.5506
🎯 Target 2: $0.6206
🎯 Target 3: $0.6844

Is Stellar (XLM) Ready for Its Next Breakout? Hello, Traders!
After an incredible rise of over 600% just in one month, Stellar (XLM) has retraced 50% but is still trading an impressive 400% higher than its November price.
This kind of volatility is a natural part of the crypto market and can often present lucrative opportunities for those who know how to navigate it.
At this point, for XLM to regain its bullish momentum, the price must break above the $0.50 level and hold there consistently.
A breakout above this psychological and technical resistance could signal the start of another leg up in its recent uptrend.
This scenario becomes even more likely considering Bitcoin current price action.
With BTC trading above $100k and BTC.D hovering at a resistance area of 59%, we could see a rotation of capital into altcoins like XLM if BTC.D starts dropping.
Historically, altcoins tend to surge when Bitcoin dominance declines, and Stellar is well-positioned to capitalize on such a shift.
As for the downside, I don’t anticipate XLM falling below the $0.39 support level.
In fact, there’s strong evidence that the recent dip to the $0.32 area marked a local bottom, supported by key technical indicators and buyer activity in that zone.
If you're trading XLM, keep a close eye on these levels and be ready to act if the $0.50 resistance is broken.
Remember, patience and disciplined risk management are key in markets like these.
Please don’t forget to boost this idea and leave your comments below.

$BINANCE:XLMUSDT TrackingBINANCE:XLMUSDT
Tracking purpose.
After the triangle breakout, Formed a pattern similar to BINANCE:XRPUSDT but a false breakout


$XLM/USDT Analysis$XLM/USDT Analysis
#XLM is consolidating within a symmetrical triangle pattern on the 6-hour chart.
The price is nearing the breakout point, and a decisive move is expected soon.
If the price breaks above resistance, it could initiate a strong uptrend. Conversely, a breakdown of the support below may lead to further downside
Waiting for confirmation of the breakout with volume before entering a position is recommended.
Entry: CMP
Target: $0.6000 - $0.7000
SL: $0.3941
DYOR, NFA

XLMUSDT: Bearish Pressure Rising – Breakdown or Fakeout?
💥 BINANCE:XLMUSDT.P continues its downtrend, struggling under a descending trendline, currently trading around 0.42018 USDT . The price has failed to break above resistance, strengthening the bearish momentum. Will we see a breakdown or a reversal soon?
---
🔑 Key Levels:
Support:
0.41998 USDT — immediate support currently being tested.
0.41651 USDT — a key level where buyers may step in.
0.40268 USDT — if price reaches here, bears are fully in control.
Resistance:
0.44319 USDT — critical level, a breakout here could break the downtrend.
0.44763 USDT — liquidity zone, potential upside target.
0.50000 USDT — longer-term target, requiring strong demand.
---
🚩 Trading Strategy:
Entry Points:
- A short setup if price breaks below 0.41998 USDT with strong volume confirmation.
- A long setup only if price shows a clear reversal above 0.44319 USDT .
Stop-Loss:
- Shorts should have SL above 0.44319 USDT .
- Longs should place SL below 0.41651 USDT to avoid liquidity traps.
Take-Profit Targets:
0.41530 USDT — first target for shorts.
0.40268 USDT — potential bottom where buyers may appear.
0.44763 USDT — in case of a bullish breakout.
---
📈 Technical Analysis:
The downtrend remains intact as long as price stays below the descending trendline.
Low trading volume suggests weak bullish momentum.
A breakdown could accelerate selling as long positions get liquidated.
---
💡 Conclusion:
Price is at a critical zone – if support fails, bears could push it below 0.40 USDT. The big question is: will this be a liquidity grab with a sharp reversal, or will bears keep the pressure on? Let's discuss! 🐻📉

XLM-USDTANTICIPATING AN IMPULSIVE BULL RUN.
After a change in directional bias we to expect a retracement to take out the region of liquidation located at (0.4154) and a continuation to the higher time frame high.
SL: 0.3917
ENTRY: 0.4154
TP: 0.5149
TP 2: 0.6500

XLm Stellar Can Surge soonHello traders
in this chart I will poblish some pivvot points also
give you an entry to GO long
if price passed last high we suggest a long postion
and also consider its not finantial advise its my analysis about this chart
consider that price should passed last high to enter
@TradeWithmky
#TradeWithMky
#Miracle
XLM #XLM

"XLM/USDT | Channel Breakout OpportunityHello traders! 👋
Here’s an exciting analysis for XLM/USDT. The price is approaching a key level, and a breakout above the current consolidation could lead to a significant move toward the channel resistance. 🚀
🔑 Key Highlights:
The pair is trading within a rising channel structure.
Order Block (OB): A key demand zone identified for potential accumulation.
Target: A potential 16.31% move toward the upper channel resistance (~0.52–0.54).
💡 Trading Plan:
A break above 0.4771 with strong volume could confirm bullish momentum.
Watch for pullbacks near the OB zone for potential entries.
Manage your risk by setting stop-loss levels below the channel midline.
#XLMUSDT #Stellar #CryptoTrading #TechnicalAnalysis #PriceAction #TradingView #ChannelTrading #Crypto #OrderBlock #BullishTrend #BreakoutTrading #Cryptocurrency
"What are your thoughts on XLM/USDT? Will it break out to the upside or consolidate further? Let me know below!"
@TradeWithMky #TradeWithmky Miracle

XLMUSDT: Trend in daily time framePlease pay special attention to the accurate trend, and colored levels.
Its very sensitive setup, ...............<<<<<<<<<<<<<<<<<<<<<<<
Be careful
BEST
MT

Is #XLM Ready For another Bullish Push or Not? Key Levels Yello, Paradisers! Is #XLMUSDT about to surge to new heights or are we on the verge of a deeper correction? Let’s analyze this critical setup of #Stellar:
💎#XLM has been forming a classic falling wedge pattern on the 8-hour chart, a formation known for its bullish breakout potential. Price is currently testing the descending resistance, and this is where things could get exciting. A clean breakout above this resistance would signal a major shift in momentum and open the door for a significant move higher.
💎When #XLMUSD clears the descending resistance of the falling wedge, the immediate resistance lies at the $0.45 level. This critical level needs to be cleared for CRYPTOCAP:XLM to confirm its bullish breakout. If bulls succeed, the next target lies in the major resistance zone near 0.6500, representing a potential 40%+ upside. Look for strong volume and convincing bullish candles above the resistance to confirm market conviction. Without these signals, any upward movement could turn out to be a fakeout.
💎However, if #XLM fails to clear the descending resistance then it might come to retest the support zone at $0.32. Buyers have held this level and the probability of jumping here is quite high. But if this level also doesn't hold, there will be a retest of the demand zone at $0.24.
💎However, a daily close below $0.24 would invalidate the bullish setup and potentially lead to a sharper drop toward 0.2000 or lower.
Stay focused, patient, and disciplined, Paradisers🥂
MyCryptoParadise
iFeel the success🌴

XLMUSDT UPDATEXLMUSDT is a cryptocurrency trading at $0.4602. Its target price is $0.7000, indicating a potential 60%+ gain. The pattern is a Bullish Pennant, a continuation pattern signaling a potential breakout. This pattern suggests a brief consolidation before a strong upward move. The Bullish Pennant is a positive signal, indicating a potential price surge. Investors are optimistic about XLMUSDT's future performance. The current price may be a buying opportunity. Reaching the target price would result in significant returns. XLMUSDT is poised for a potential breakout and substantial gains. The Bullish Pennant pattern typically leads to a strong upward move.

XLMUSDT: Bullish Setup or Reversal on the Horizon?Yello, Paradisers! Are you ready to capitalize on XLMUSDT’s next big move? Let’s break it down!
💎XLMUSDT has been consolidating within a well-defined descending channel, a classic retracement pattern that often sets the stage for a bullish breakout.
💎If XLMUSDT breaks and closes a candle above the resistance level, it would strongly increase the probability of a bullish move, opening the door to significant upside potential.
💎On the flip side, if the price dips to shake out weak hands, key support zones will be crucial. A bounce from these areas, coupled with a bullish I-CHoCH (internal change of character) or reversal patterns like a double bottom (W) or an inverse head and shoulders, would signal strength and increase the probability of a sustained rally.
💎However, discipline is key! If the price breaks down and closes a candle below the support zone, it invalidates the bullish setup. In such a scenario, it’s wiser to wait for clearer and more favorable price action to unfold rather than rushing into a trade.
🎖 This market rewards patience and preparation. Always remember, the goal is consistency, not chasing impulsive moves. Stay disciplined, Paradisers, and let’s crush these markets with sound strategies and precision!
MyCryptoParadise
iFeel the success🌴
