Trading opportunity for XLMUSDTBased on technical factors there is a Buy position in :
📊 XLMUSDT
🔵 Buy Now
🪫Stop loss 0.4320
🔋Target 0.4900
📏 R/R 2,8
💸RISK : 1%
We hope it is profitable for you ❤️
Please support our activity with your likes👍 and comments📝
XLMUST trade ideas


XLM/USDTKey Level Zone : 0.4400-0.4460
HMT v3.1 detected. The setup looks promising, supported by a previous upward/downward trend with increasing volume and momentum, presenting an excellent reward-to-risk opportunity.
HMT (High Momentum Trending):
HMT is based on trend, momentum, volume, and market structure across multiple timeframes. It highlights setups with strong potential for upward movement and higher rewards.
Whenever I spot a signal for my own trading, I’ll share it. Please note that conducting a comprehensive analysis on a single timeframe chart can be quite challenging and sometimes confusing. I appreciate your understanding of the effort involved.
Important Note :
Role of Key Levels:
- These zones are critical for analyzing price trends. If the key level zone holds, the price may continue trending in the expected direction. However, momentum may increase or decrease based on subsequent patterns.
- Breakouts: If the key level zone breaks, it signals a stop-out. For reversal traders, this presents an opportunity to consider switching direction, as the price often retests these zones, which may act as strong support-turned-resistance (or vice versa).
My Trading Rules
Risk Management
- Maximum risk per trade: 2.5%.
- Leverage: 5x.
Exit Strategy
Profit-Taking:
- Sell at least 70% on the 3rd wave up (LTF Wave 5).
- Typically, sell 50% during a high-volume spike.
- Adjust stop-loss to breakeven once the trade achieves a 1.5:1 reward-to-risk ratio.
- If the market shows signs of losing momentum or divergence, ill will exit at breakeven.
The market is highly dynamic and constantly changing. HMT signals and target profit (TP) levels are based on the current price and movement, but market conditions can shift instantly, so it is crucial to remain adaptable and follow the market's movement.
If you find this signal/analysis meaningful, kindly like and share it.
Thank you for your support~
Sharing this with love!
HMT v2.0:
- Major update to the Momentum indicator
- Reduced false signals from inaccurate momentum detection
- New screener with improved accuracy and fewer signals
HMT v3.0:
- Added liquidity factor to enhance trend continuation
- Improved potential for momentum-based plays
- Increased winning probability by reducing entries during peaks
HMT v3.1:
- Enhanced entry confirmation for improved reward-to-risk ratios

Support zone: 0.4024
Hello, traders.
If you "Follow", you can always get new information quickly.
Please click "Boost" as well.
Have a nice day today.
-------------------------------------
(XLMUSDT 1D chart)
As it rose this time, the candle's body color changed to green (#42bda8, #00332a).
In order to continue the short-term uptrend, the price must be maintained around 0.4024 or higher.
If it fails to do so and falls below 0.3747, it may fall to around 0.3070.
-
Since the high point boundary zone is formed in the 0.4931-0.5362 zone, the point of observation is whether it can break through this zone upward.
Therefore, when the support is confirmed around 0.4024, it is the time to buy.
-
Thank you for reading to the end.
I hope you have a successful trade.
--------------------------------------------------
- Big picture
I used TradingView's INDEX chart to check the entire range of BTC.
(BTCUSD 12M chart)
Looking at the big picture, it seems to have been maintaining an upward trend following a pattern since 2015.
In other words, it is a pattern that maintains a 3-year upward trend and faces a 1-year downward trend.
Accordingly, the upward trend is expected to continue until 2025.
-
(LOG chart)
Looking at the LOG chart, you can see that the upward trend is decreasing.
Accordingly, the 46K-48K range is expected to be a very important support and resistance range from a long-term perspective.
Therefore, it is expected that prices below 44K-48K will not be seen in the future.
-
The Fibonacci ratio on the left is the Fibonacci ratio of the uptrend that started in 2015.
In other words, it is the Fibonacci ratio of the first wave of the uptrend.
The Fibonacci ratio on the right is the Fibonacci ratio of the uptrend that started in 2019.
Therefore, it is expected that this Fibonacci ratio will be used until 2026.
-
No matter what anyone says, the chart has already been created and is already moving.
It is up to you how to view and respond to this.
If the ATH is renewed, there are no support and resistance points, so the Fibonacci ratio can be appropriately utilized.
However, although the Fibonacci ratio is useful for chart analysis, it is ambiguous to use it as support and resistance.
The reason is that the user must directly select the important selection points required to generate Fibonacci.
Therefore, since it is expressed differently depending on how the user specifies the selection points, it can be useful for chart analysis, but it can be seen as ambiguous to use it for trading strategies.
1st: 44234.54
2nd: 61383.23
3rd: 89126.41
101875.70-106275.10 (when overshooting)
4th: 134018.28
151166.97-157451.83 (when overshooting)
5th: 178910.15
-----------------

XLM Bearish Harmonic or Bullish Flag!There are two possible scenarios for XLM.
1. Bearish Harmonic Pattern:
This is the more likely scenario.
XLM may revert to the bottom of the channel.
A good entry point for a long position could be between 0.28 and 0.31.
2. Bullish Flag:
This is a less likely scenario.
XLM may experience a bullish breakout.
Important Note:
Open your position carefully.
Evaluate your risk tolerance and investment objectives before entering any position.
This analysis is for informational purposes only and does not constitute financial advice.


XLM and XRP 's breakout#xlm #stellar price has just made a breakout of the falling trend and it seems CRYPTOCAP:XLM is heading to a retest. A successful retest will likely ride #xlmusd to the impulsive wave.

XLMUSDT 8H#XLM has bounced off the EMA200 on the 8H chart and is ready to break out above the trendline. In case of a breakout, the targets are:
🎯 $0.4416
🎯 $0.5215
🎯 $0.5860
🎯 $0.6505
🎯 $0.7424
🎯 $0.8594

Xlm/UsdtBINANCE:XLMUSDT
💹 XLM price is at 0.3308, holding a weak support area. 🔻 Price may see corrections both down 📉 and up 📈, but likely to hit the 0.3600 area. 📊 On the daily ⏳ and weekly ⏳ charts, it's trending down, and on the 4-hour chart ⏰, it's showing a weak area. ⚠️
🔔 Not Financial Advice! 💡

xlmI'm hoping this area is green, and if it can't hold, we should come and check further down in the purple lines.

Be careful with XLMUSDT !!!The price is currently in a bullish flag or possibly an ascending wedge, which could cause the price to increase and rise up to the 0.618=$0.51 line.
Give me some energy !!
✨We spend hours finding potential opportunities and writing useful ideas, we would be happy if you support us.
Best regards CobraVanguard.💚
_ _ _ _ __ _ _ _ _ _ _ _ _ _ _ _ _ _ _ _ _ _ _ _ _ _ _ _ _ _ _ _
✅Thank you, and for more ideas, hit ❤️Like❤️ and 🌟Follow🌟!
⚠️Things can change...
The markets are always changing and even with all these signals, the market changes tend to be strong and fast!!

XLM/USDTI think that wave 2 is over, so I will buy for wave 3. Wave 3 targets are included in the chart.

XLM/USDTI think it has completed wave 4. I am buying with this setup. 1% risk for this setup. Don't forget about capital management.

XLMUSDT pair TAExpecting XLM to tap down with gray on the MTF Wave indicator prior to an attempt to retest flag's upper resistance trendline. check out how an ideal Stochastic Wave reversal looks like on the conceptual MTF on the side for reference..

Its a Good Buy Opportunity By The High R/R📈 Finally Seems XLM Bottomed And Wave E From Main Corrective ABCDE Formation Is Completed At The Local Low Of a Bull Flag, Expect a Breakout From a Flag Soon Toward a 0.568$, 0.726$ And 0.84$

xlmIn the high time frame, it has made a move
If it wants to reverse 50% of the move, it can reach the yellow lines, but on the other hand, there is another channel midline
But in the short term, we have a conflict between the green and red boxes, and a break from either side activates the next areas
It is safer to buy in the blue points

Bullish trend: XLMUSDTThe United Nations has officially recognized Ripple and Stellar as vital components of the global financial infrastructure. The Decaf payment platform is fostering financial inclusion in Latin America and Africa. SWIFT's Swift Go platform has achieved significant adoption, with over 600 banks and 400 financial institutions on board. Ripple and Stellar Lumens are acknowledged as leading contributors to cross-border payments and regulatory compliance. Stellar Lumens is also expanding its capabilities to include smart contracts, posing a challenge to Ethereum's dominance in this space.

XLMUSDT Short Idea - Struggling to Maintain Bullish MomentumXLMUSDT has had a strong run up to ~$0.63, as have many other alts, but is now struggling to maintain that bullish momentum.
Looking at a fib retracement view of the bullish push, we can see that the price action has been oscillating between the 0.5 and 0.618 fib levels and has once again been rejected off the bottom of the 0.5 level.
This chart shows a lower timeframe snapshot of that price action rejection off the bottom of the 0.5 fib.
From a bearish push fib retracement view, we can see that there is confluence between the 0.5 bullish fib level and the 0.618 bearish fib retracement region. We can see this level holding well and a potential rejection back down towards another bearish move.
The target for this short idea is a combination of the supply order block level sitting around 0.26, and the -0.618 fib extension level of the bearish fib retracement fib. Stop placement is above the order block flip zone indicated by the yellow box. For lower timeframe traders, a tighter stop could be attempted if you watch the price action closely following a breakdown below the last point of support at 0.38.

XLM/USDTKey Level Zone : 0.38283-0.42128
HMT v2.0 detected. The setup looks promising, supported by a previous upward/downward trend with increasing volume and momentum, presenting an excellent reward-to-risk opportunity.
HMT (High Momentum Trending):
HMT is based on trend, momentum, volume, and market structure across multiple timeframes. It highlights setups with strong potential for upward movement and higher rewards.
Whenever I spot a signal for my own trading, I’ll share it. Please note that conducting a comprehensive analysis on a single timeframe chart can be quite challenging and sometimes confusing. I appreciate your understanding of the effort involved.
If you find this signal/analysis meaningful, kindly like and share it.
Thank you for your support~
Sharing this with love!
HMT v2.0:
- Major update to the Momentum indicator
- Reduced false signals from inaccurate momentum detection
- New screener with improved accuracy and fewer signals

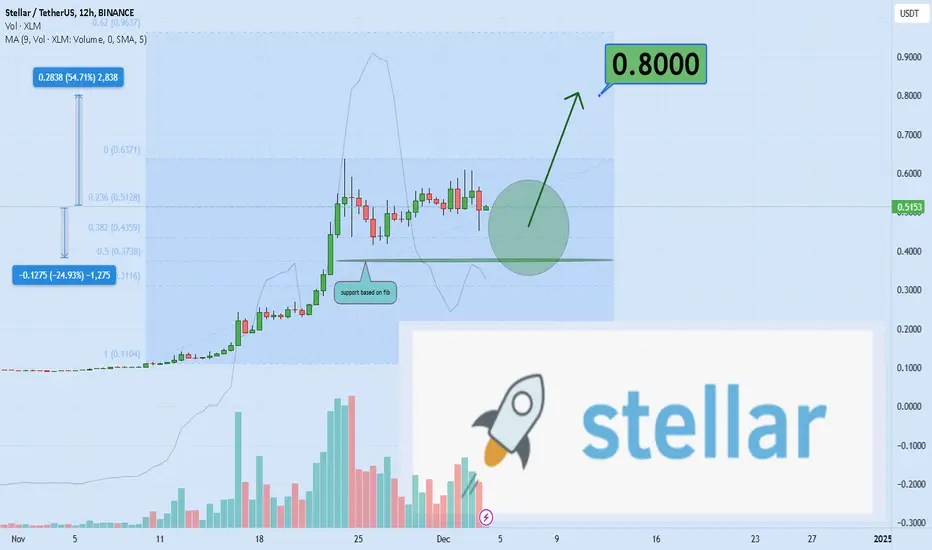
Stellar ( 0.80$ ) is uploading.Hello and greetings to all the crypto enthusiasts, ✌
I aim to provide you with a comprehensive overview of the future price potential for Stellar , 💡
The elevated trading volume, coupled with the technical chart analysis, strongly suggests a minimum upside potential of 50% for XLMUSDT. A significant portion of capital from the previous bull market is still embedded within it, signaling a solid foundation for growth. Should the stock experience an upward movement, it is likely to attract renewed interest from former investors, which could catalyze further investment inflows. 📚🎇
This trend would not only drive price appreciation but also reinforce investor confidence. As a result, XLMUSDT presents a compelling opportunity for both current and prospective investors.
🧨 Our team's main opinion is: 🧨
The high trading volume and technical chart suggest a 50% upside potential , with significant capital from the previous Saudi market still invested. A price rise would likely attract former investors, boosting momentum and investor confidence.
Thank you for your attention. If you have any questions or comments, I’m here to respond to you. 🐋💡

XLMBreaking out with good volume
I expect a retrace to .5-.618 fib levels which match with ema's and that will be my entry for long
Using 20x lev
SL as seen on chart
GOOD LUCK!

XLM Ready for Lift-Off? Wait for Breakout of $0.458!Stellar XLM is still trading in the range zone between $0.40 and $0.46 with the sideways price action.
1. If XLM can break through $0.458 with confidence, bulls might take over and aim for the next resistance at $0.525 and, possibly, higher. That’s where momentum could build up nicely, potentially giving traders something to cheer about (Solid Green Projection).
2. The price is pushing higher. However, if the price stumbles here, we’ll need to watch closely. A minor pullback to $0.431 and a bounce higher would signal buyers still have skin in the game (Dashed Green Projection).
3. On the other hand, if sellers step up and push XLM below $0.399, things could take a bearish turn. A drop toward $0.325 would be the next logical stop, and traders may want to brace for a deeper pullback if that level fails (Red Projection).
In short: $0.458 is the decision zone. A breakout or breakdown will set the tone. Bulls have a target at $0.525 and then $0.593, while bears have their eyes on $0.40—let’s see who blinks first!
