XLM to gain on XRP over 3x this cycleXLM has been gathering energy technically and fundamentally against XRP for years...
expect an equal and opposite reaction...
XLM will be .36 XRP before you know it!
Related pairs

Will XLM Outperform XRP This Cycle?The chart clearly has the potential to reach 0.68 XLM for every XRP, which means if XRP reaches $28 by the end of the cycle, XLM can be around $19. I don’t think this chart will ever make a higher high and it will continue to make lower highs, but this cycle even a lower high to 0.68 is means XLM wi

Breakout Soon?So many people are waiting for an explosive XRP, bull run. This chart looks like XLM/XRP wants to breakout of the symmetrical triangle. If that happens and the xrp bull run happens, then imagine what XLM will do. I have no evidence that we will see a breakout, but the weekly RSI and a similar symmet

HypothesisIf xrp hits 44 dollars by the end of the cycle and this chart plays out then XLM could be worth 59% less than XRP, which is still a higher ROI than XRP, but I really don’t know if this scenario will happen or not. If someone could take a look at this chart and expand on the idea it would be nice.

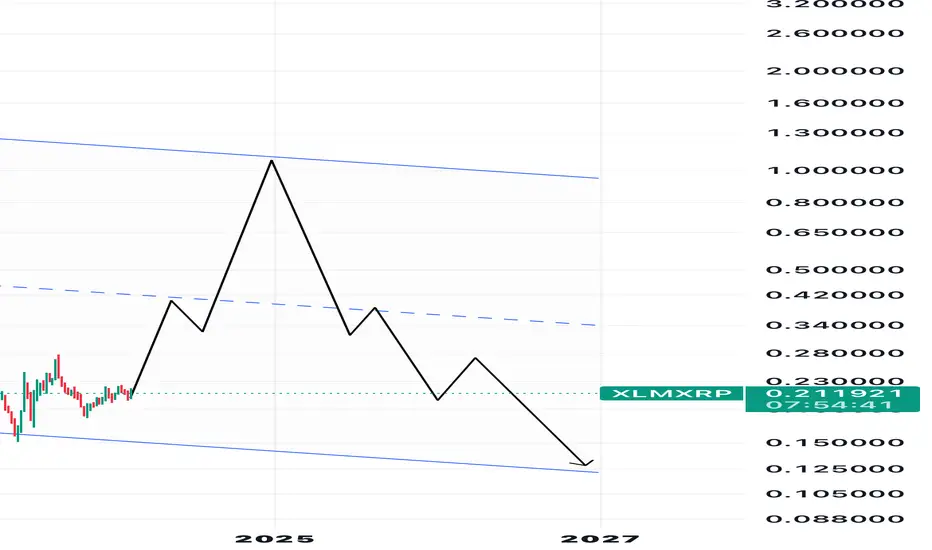
Beginning of UptrendXLM is officially in an uptrend against XRP and the next major resistance stands at 0.37 ratio.

$XLM SET TO RUN AGAINST $XRP FOR YEARSCRYPTOCAP:XLM is at a macro bottom against CRYPTOCAP:XRP
This is a generational Opportunity
WE AWAIT THE LIGHT
1X10^(-27) LM

See all ideas
Summarizing what the indicators are suggesting.
Oscillators
Neutral
SellBuy
Strong sellStrong buy
Strong sellSellNeutralBuyStrong buy
Oscillators
Neutral
SellBuy
Strong sellStrong buy
Strong sellSellNeutralBuyStrong buy
Summary
Neutral
SellBuy
Strong sellStrong buy
Strong sellSellNeutralBuyStrong buy
Summary
Neutral
SellBuy
Strong sellStrong buy
Strong sellSellNeutralBuyStrong buy
Summary
Neutral
SellBuy
Strong sellStrong buy
Strong sellSellNeutralBuyStrong buy
Moving Averages
Neutral
SellBuy
Strong sellStrong buy
Strong sellSellNeutralBuyStrong buy
Moving Averages
Neutral
SellBuy
Strong sellStrong buy
Strong sellSellNeutralBuyStrong buy
Displays a symbol's price movements over previous years to identify recurring trends.