XMR.btc catches a Bid, but is now approaching Resistance ZonesQuick post to map some upcoming resistance zones.
Perhaps McAfee's shilling on twitter is causing the buying?
Perhaps the Iran situation is causing a run to privacy coins?
Whatever the Force, we can observe/measure the Results.
Currently pushing first strong resistance zone around 74k
The next resistances are at 1k multiples above (roughly).
Sorry for the messy chart, did not have time to clean up.
Drag UP on the PRICE scale to enlarge the overlaps in digits.
Drag RIGHT on TIME scale to see more history/fibs on left.
.
See some of my other plots and trade calls below.
I also plot Forex and Stocks, take a look at my profile page .
EOS top Call (near perfect plot)
LTC to $150 call (near perfect plot)
BTC $14k call (Near Perfect target, easy trade)
ETH breakout (instant Profits, no drawdown)
BTC bottom 3.1k (caught the EXACT bottom)
ADA breakout (PERFECT targets, massive profits)
ZRX bottom call (200% gain, Perfect target)
XLM breakout (massive Profits, instant Win)
RVN top call (Perfect Target, take profits)
LINK re-entry (caught the spike)
NEO Rocket Launch (great entry, massive profits)
FET top warning (EXACTLY on time)
Of course, I have had total FAILS on some ideas too, not going to pretend.
But all of my plots show PRECISE entries, TIGHT stops, and EXACT targets.
Precision is the way of the Fib. Almost every turn happens at a Fib Line.
XMRBTC trade ideas

XMR/BTC BUY SIGNALI missed the entry point which was at todays' bottom. Although it is still a good buy trade, especially if it corrects slightly down

Monero on the way to uptrendXMR slowly reversing. Pumped and dumped yesterday, which confirmed it wasn't ready for reversal yet, but time may come soon. Waiting for it at 6900-7000. Than we will see.
Bearish scenario - dump lower to 6450. Or even lower to the bottom of current trade range at 6200.
Bullish scenario - bounce above 6850 and consolidation above 7000. Not expecting it to grow fast, but slowly build the reversal.

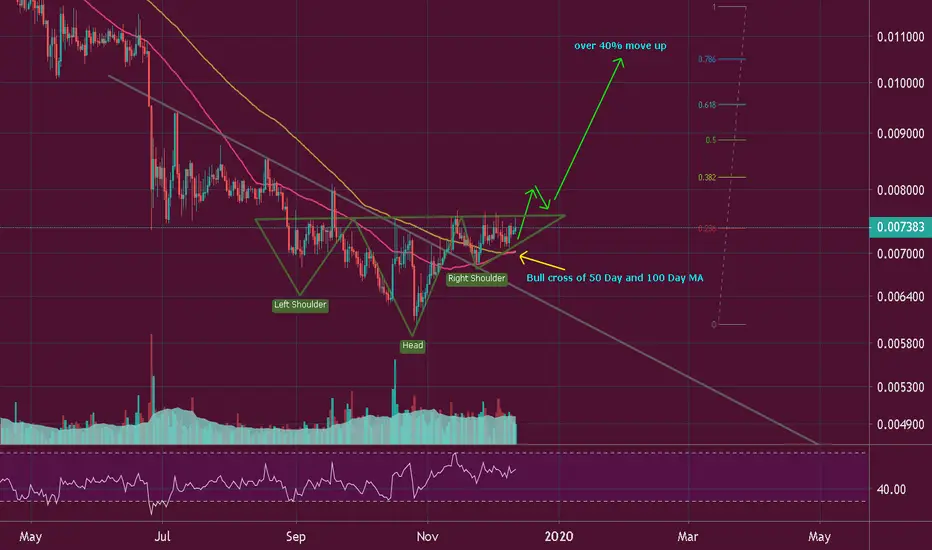
XMR/BTC 4h Monero cup & handle strong bullish momentumMonero Research Lab released Triptych on the 6th of January proposing trustless logarithmic-size ring signatures. This could improve coin’s privacy significantly. Also there are plenty of good news suggesting that 2020 might be a good year for privacy coins. Monero has been around for a long time and is inline with Bitcoin, Ethereum, Litecoin and other top currency when it comes to investors trust. Looking at the 4hrs and daily charts we can see a very bullish cup & handle formation. Volume is also picking up. XMR/USD chart is also forming inverse head & shoulders pattern, which is another bullish signal.

XMR/BTC (idea 2), buy after retraceI posted an idea on this earlier, but this seems to be the more likely scenario because I do see some bear div on the hourly TFs, although it is possible both scenarios play-out.
This retrace could happen first and then the pump to 93xx.
These are just my own opinions and should not be considered financial advice, please do your own research.

XMR/BTC, BEARISH BUTTERFLY, 28% POTENTIAL FROM CPXMR/BTC is completing bearish butterfly pattern whih goes into our 0.382 fib resistance, 28% potential from cp, if you can get it cheaper before it hiits target, get it
I AM NOT A FINANCIAL ADVISOR, DO YOUR OWN RESEARCH! These are just my trading ideas and opinions that I am sharing.

Likely Short Term Pain and Suffering/Long-Term QuestionableXMR:BTC tried to push through longstanding resistance (~750k sats, 26 Aug 2019) recently, which it has only pumped above once (18 to 19 Sep 2019) since on the daily, not counting wicks, or 6 to 7 Jan. The push was rejected. MACD looks like it wants to cross over and take a dip. May get to 740k sats again before dumping as low as 650k sats again. At ~722k sats atm. Still, this is close to the historical and recent low for XMR, and the next few months may be interesting for BTC, and not in a good way. I expect a short-term break below the orange trend line. If you can short XMR, a setup around 740k with targets around 680k and 625k sats might do well. Anything under 600k sats is further price exploration.

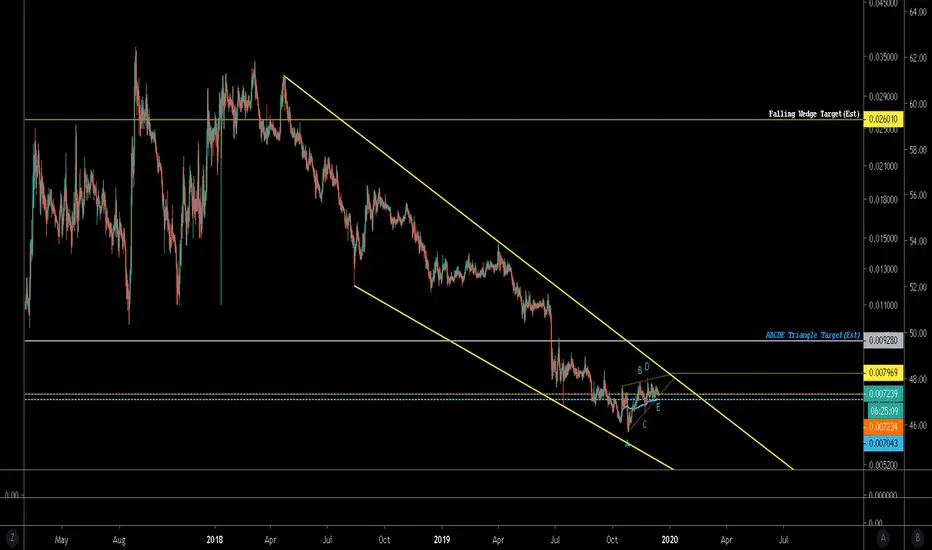
XMR 2020 AnalysisSince the new year broke, so too did the resistance that was holding down Monero (XMR). It has done some very impressive moves on the chart, whomever is the market maker is really having a blast with the volatility.
As you can see from my analysis, XMR is in an ascending wedge, and looks extremely bullish.
Points appear to converge on the short term around the 14th or 15th.
Should be a fun ride.

Monero Cup & Handle/Scallop?If we break the lip of the handle soon it looks promising!
thepatternsite.com
thepatternsite.com

Wait are u saying Monero surging 150%? Maybe lolHey, so from where we stand this is looking promising.
It sure is a lot easier to go long now, than say short at this levels.
We got some volume vacuum, so price can;t really stay here for too long unless we go for range trading or side action for awhile before we get out the descending channel.
it appears that 1-5 wave is also closing to an end and we might be looking for abc action.
Also, volumes where are they? I am looking at POLONIEX, so it might be deceiving.
Good Luck Everyone! Happy New Year, lets make Crypto Great AGAIN!!
**LEGENDS**
BLUE = Bear/Resistance
Yellow = Bull/ Support
Vertical Lines: Fractal dates are moments of interest, where price and time collide to create oscillation.
~Explore the chart for possible scenarios of price actions - use zoom and scroll for better view.~
/*This information is not a recommendation to buy or sell. It is to be used for educational purposes only.*/
Feel free to request: your coin to be analyzed! Please keep those Stop losses in place!
Thank you,
Please, follow, help me get to a 1000 followers :)

XMRBTC Support Resistance Horizontal Line Break
Horizontal Line Retest (Entry)
Entry on the Retest
Target is next horizontal support resistant line.

XMR/BTC Monero Break out?!XMR is testing a long term resistance wich started in 2018. if there is a daily candle closing above resistance I think it can take a journey to 0,01 BTC.
Mnero is a privacy coin and it´s nearly decentralized. When all the new people are coming into the crypto market and realize that all pubic blockchains are trackable they will search for privacy!
Monero is one of the best Privacy coins. The price never went down to all time lows as many other coins did.
It would be a really good long term entry if it breaks out .
* no financal advise :)

$XMR, Pushed and crossed over ~687k sats resistance...$XMR
Pushed and crossed over ~687k sats resistance level and now is retesting it on the Daily chart on a potential R/S...
If happens, then aiming for a new leg up with target at ~735k+ (8%+)
Crossed above EMA50, UCTS Buy signal on the 1D
Ton of room to grow from here..
#XMR

Monero Prolonged Adam & EveMonero has broken out from a prolonged adam and eve setup. Simple chart. Simple trading pattern.


Start accumulating Now !! Short termEasy profit in short term .
Stop loss :- if a candle closes below the blue box then sell it .

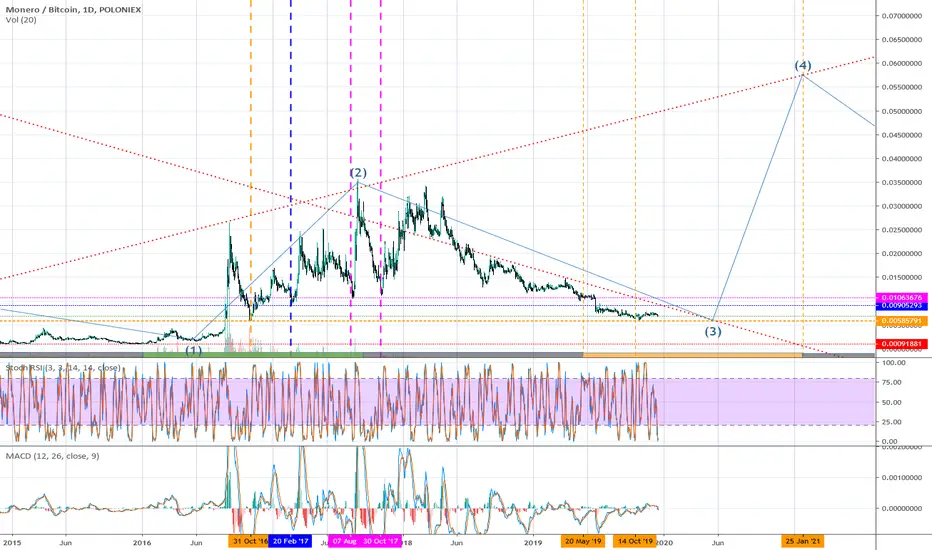
$xmr #xmr #monero thoughts on the daily based on pastTLDR; i think the slow bleed down is coming to a conclusion at the 006 and then up, and it should be violent up to 015 or whatever I wrote on the chart. OR its going to continue slow bleed and bring us to .004x without any interesting reaction at all until then. Thats right. up or down.
Decided to look at a few charts and get some ideas of whats happened, and what i can see going forward using a chart with a decent history (should bring some nostalgia of polos old days for anyone around back then with xmr).
theres a lot going on in this chart. ive tried to number the comments and my thoughts.
right now we are in a strong downtrend, and a very efficient one at that. lots of buys, lots of sells, but we keep going down, no big spikes and re accumulation and up, but just slow bleed down. thinking now, i could make several charts just on the last few months on a lower TF but just takes so long. I do this for a few reasons, 1 is fun, 2 is to have some idea whats going on what i see, and what others see, and 3. to have a log saved, so i cant spend another hour making 3 more charts on xmr on different TFs.
If you have some questions do post them below or message me. I always appreciate ppls feed back and thoughts, good luck.
ps. been a long time since an xmr chart so some of the links below are a bit dated.

XMR/BTC TA Update (Bullish Inverse Head & Shoulder Pattern?)XMR/BTC
Monero is at the edge of completing the Right Shoulder of the Inverse H & S pattern. If price can break above 7660 sats,
Expect further upside movement as the market structure will turn from bearish to a bullish uptrend.

Why volume is not always an indicator of valueAs you can see in XMRBTC the volume has been increasing steadily over the years, (possibly fake volume), this leads people to the conclusion that a lot of buyers are present when in reality price is steadily declining and care should be taken when choosing to invest. My conclusion is that volume has little to no correlation to price action, and analysis should be made using various other TI (linear regression, Fibonacci zones for example). First educational post feedback is nice.
