XMRBTC trade ideas

XMR/BTCMy favorite coin to survive the shakeout. By far the safest bet in crypto, but probably the least rewarding.
Twice I've called alt season and twice I've failed.
Third time's the charm?
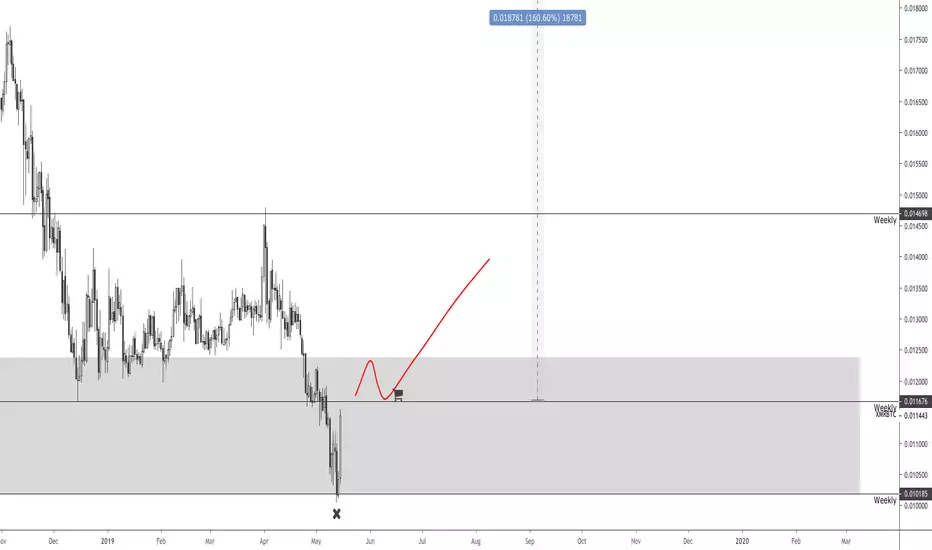
Alt charts should be making their way to the disbelief stage vs USD very soon, now that BTC has had its steep "sucker's rally".
I've seen the alt market act like this before, in December of 2017.
It appears the algorithms are using the same technique to hunt. Push down until there's no sellers left, then retest. Short term Adam & Eve.
Will the alt boom be as meteoric as December 2017?
Before, I was under the impression it would be a slow, tangent rise to the disbelief stage, but then we saw what BTC just did, so I looked back at the dot com bubble.
Same players, similar game.
Amazon, for example, took 40% of the time it took for its depression phase, to get to the top of the disbelief phase.
How does that look for alts? ~200 days of depression phase = ~80 days of uptrend to the top of the "sucker's rally".
Alts that are going to survive should be able to go to 35%-65% of their peaks of the bubble, in this phase.
XMR, for example, peaked at $480, so it should be able to make it somewhere in the range of $168-$312 within this 3 month period.
While BTC falls value, into disbelief, this should show a 2.5-5x rally, relative to BTC.


XMRBTC Finally going to make some NOISEJust want to start off and say thank you for taking the time to read my post.
XMR/BTC
My interest lately has been on Monero (XMR). Throughout this mini "alt szn" Monero has held pretty quiet, all while loading into a pattern. After looking more into it, Monero is setting up the same candlestick format as its local bottom back in August of 2018. This move back in 18 had monero on a +30% decline into a triangle, where it would explode out to post a 47% gain. It blew off steam at the .65 fib extension (my preference to use over the .618 fib) which is where it was met with a correction. This time around we are also on a +30% decline into our triangle, however I'm eyeing a smaller jump than before. My trade setup R:R is 5.7 (4.3%--->24.6%).
I hope I was able to elaborate my plan and reasoning behind this next move, good luck!


[XMRBTC] SHORT-TERM LONGLong in sort-term period. Also buy volumes on this coin prevail over sell volumes.


Possible Monero moon shot in 36hoursMonero nearing to a critical point in history.
Price range going closer and now working btc pairing vs. usd(t) pairing.
If we can break that down trend, 180 - 220$ in coming weeks!
Stop loss at 0.01080sat.
RSI + STOCH RSI ready for moon shot!
Binance wallet under maintenance.

XMR/BTC - 1D Chart (Long)XMR/BTC is currently trading sideways between B.0120 and B.0139. B.012 has acted as strong resistance, rejecting the price on four separate rallies. Price is now trending down towards the lower level of the equilibrium and probabilities favor a break of that level. If that level is successfully breached my first target is set in the previous price cluster between B.017 and B.18 (35%). Updates will be provided as this trade develops.


5 minutes from sleep. Let's do a chart! XMR/BTCI'm dreaming of a massive inverse H&S marking the reversal point. The USD chart looks good, a positive trend against BTC would seal the deal for some parabolic maneuvers. I like to have these charts as reference points for myself, other people laughing at me is just a bonus.


Possible 100% gains on Monero XMRBTC Hi All
Looks like its time for this forgotten coin.
Chart says it all.
Looks safe.
I use a stop loss, and add several sell targets up tp 2X
Does this look like a chart that deserves a like ? Thanks ! :)

Lets get ready for This BaBy Bull!! XMR!! Dam Xmr!!
i love everything about you
so
we gonna trade you for the next 3 years
lets start
Xmr in great loction for long term hodl
=
So this is the plan
they might squsse us for 1-3 months xD
But we are ready for it as well
so follow the golden rule
signal pop up? enter market and wait for close might take 2 weeks might take 2 months xD
THE longer it take the more we can do
lets say buy order apper at 0.01 and you buy 100xmr
and xmr keep dumping in term of usd what we do ?
adding 25xmr to our xmr holding every week ingnoring price
2 months? 300 xmr
4 months? 600xmr or more xD
entery isnt 0.01 any more more likly near bottom prices lets moon!!! fuck weak hands we will accumelte xD
Probbly 3-5 years of bloddy bull xD
so lets be bull throw the good and bad xmr we love you!! but we just want more badgers!!! btc the king!!
ibb.co
we getting near to a signal to shot up
thats mean or insta moon
or scale time and remmber bull always win just keep buying xD
Party starting now

Monero vs EthereumCant really say what's going on here.
It is an interesting chart though so I'll just post it so we can keep an eye on it.

XMR/BTC at or near Bottom? Monero below Fib Floor on DailyThe above chart is zoomed in for clarity, see full picture below.
Monero and almost all of the Alts are being dessimated by BTC.
The primary wave in this drop should have ended at the red 9.618.
Bitcoin going Ultra-Bull killed this bounce and then broke the floor.
It has just now pierced and resurfaced from a perfect Confluence.
That may have been a stop hunt as there was no Daily Close below.
But two Daily wicks below is NOT a good sign, so I am looking lower.
IF the 10.236+4.382 at 105k sats was the bottom, we need an impulsive bounce.
But to be honest the 4.382 is not a common wave ender, 4.236 should have been.
So I am looking at the blue 4.618 (common endpoint) and red 10.618 confluence.
Here is the full picture showing origin of the two Fibs:


XMR BTC A small dip around 13%Stoch RSI (1W) shows that there will be a small dip in a week. A good point to enter, cause Stoch RSI (1M) is still low ready to go up.

Monero could be headed much lower.Monero looks like it is headed down to the longer term trend line, but the technicals look bad. If it moves down and then through the long term trend, there's not much to hold it up until BTC starts upward again.

