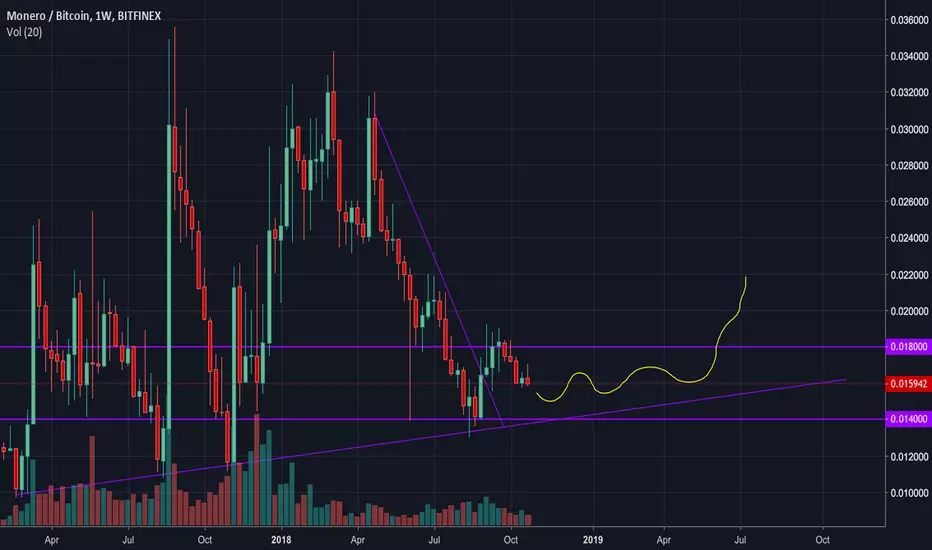
XMRBTC [Daily] Breakout, retest and higher...Monero daily char: mid/late August stops were taken out below 0,015 but bulls were able to back above in September.
Looks like consolidation/retest phase coming to an end and may see higher prices towards 0,020/0,022
XMRBTC trade ideas

$XMR... For Those Who Loves Bluechips In CryptocurrencyI think i don't need to explain a lot about it's fundamental background, Monero is really famous on it's privacy development on crypto even it has a copy cat like Linda Coin. We can say XMR as one of the pioneer for privacy coin in this game.
Alright, how do i judge the chart at the moment?
Okay, guys, I think this is a good time to scoop monero because of after a dead cat bounce we see there is a healthy correction which a seeking a good support to start the second rally.
As the green box is where we actually consider as a zone which juicy to buy but I doubt we can go lower if BTC stabilize above $6.5K - $6.6K so this is your chance.
The first fibo touch at 0.236 and i'm looking for the next thing to touch is 0.382 and then straight up to 0.618 with healthy correction in between.
I also love another two indicators below is showing a good low.
If all of these ideas I posted helps you, give them thumbs up, shares, comments and follow me. If you have a suggestion, just fill in the comment sections or message me. Looking forward to hear from you all. Thanks a lot!
-------------------------------------------------------------------------
www.tradingview.com Rules:
#1 Always obey tradingview.com house rules
#2 Always read the description
#3 Don't spam on the comment section
#4 If you wanted to request my opinions about a coin/token just give 10 likes on my published charts and I will do it the day or two after
#5 My opinions are not financial advice, follow it at your own will and your own risk
#6 Together, let's build a better community on this platform
-------------------------------------------------------------------------

Monero shakeout then breakout?Positive market sentiment combined with bulletproofs. XMR been dancing at support. Whales accumulate. One last shakeout before an uptrend.


XMR/BTC: I smell an uptrendGreen X: Candlesticks are inching higher than the respective hulls MA: Nice golden cross indicated by KIA's Hull MA! Black line indicates theat the previous dipping was a fakeout
Green Smiley: Encouraging green volume
MACD: Crossover
I smell an uptrend for XMR. Conservative traders can wait for the candle to close above the HMA 55(Blue Line)
AS USUAL, aim for 10-30% profits.
1. Set stop loss(Stop limit SELL) at 90% of your entry price
2. Use blockfolio/delta/trading view to set alert to the following targets(Note: you can adjust target prices and % to sell according to your risk appetite):
Target 1: IE when price reaches 105% of your entry price, sell 30% of what you bought
Target 2: IE when price reaches 110% of your entry price, sell 30% of what you bought
Target 3: IE when price reaches 115% of your entry price, sell 30% of what you bought
Remainder: Open target. Set trailing stop loss(Stop limit SELL at 5-10% below market prices) and let ride/sell when comfortable

$XMR Bull CasePotential Bullish Divergence on the 1D chart, Breakout for 15 % gain to Sept Levels
Open : 0.016239 - 0.0162336
T1 : 0.016814
T2 : 0.017390
T3 : 0.017984
T4 : 0.018752
S/L : 0.015783 ( 5% - adjust as your risk threshold allows )
* Not Financial Advise, tracking this for learning purposes

XMR / BTC: Long term thoughtsUnique chart here on XMR / BTC, unlike most alts. Bullish long term for fundamental reasons on Monero, but it looks like it will accumulate for a little bit and likely breakout, this has been typical of XMR in the past.
XMRBTC Long at DAILY DEMANDDaily demand would make for a fantastic long entry. May the Gods be so generous.
GLGT

Catch The Break OutGetting close to making a move.
Could go either way. Leaning bullish because of previous move up.

XMR LongLooks like XMR finally wants to join alt season. Bbands are insanely tight. VPVR resistance at .017636 will be the key breaking point for this coin. I would like to see a break of that resistance before considering taking a position. Trade safe!

Monero (XMRBTC) analysis The 6 hour timeframe of XMRBTC (Monero) captures over a year and 2 months of price action.
The sideways price movement is best described in this analysis as a symmetrical triangle, with extremes of the chart pattern i.e. support and resistance indicated by the dark blue lines.
The most recent uptrend starting August 15, 2018 is described using a bullish channel that is tentative. A break below the channel, and also support at 0.015469 could result in price action reaching 0.013192 or lower.
A break above the channel however at 0.022360 could see the price action test resistance at 0.032487.

MONERO : the long-term perspective analysisXMRBTC
Indicators are different. Aroon show us signal to sell, and we see RSI oversold that say we should to buy some percent in the near movement down.

XMR 10.24.18Monero, like almost every other coin, is fast approaching a moment of decision.
So many altcoins are near critical resistance. If btc were to break significantly it would have severe ramifications across the crypto world. In such a disastrous scenario there would inevitably be some survivors that rise from the ashes like a phoenix. Nobody could possibly predict who those fiery future birds might be.


Monero (XMR) major upgrade makes it officially “Bulletproof”Following past months of development, Monero was preparing for a major upgrade, which yesterday was successfully activated. So what is the upgrade all about?
On the 18 October, Monero has implemented a Bulletproffs protocol, which is an advanced technology that makes any blockchain more efficient, cheaper, faster and more scalable. This method for sending private transactions, is considered to be the most effective, which can have a massive effect on Monero, now and in the long term future.
It is time to look at the price action since the Bulletproffs protocol has been integrated …
Clearly, market hasn’t reacted yet, as during the past few days it continues to trade near the 61.8% Fibonacci support level at btc 0.0015756. However, what should be noted, is that this level has been tested a number of times, and each time price rejected it. The important thing is that after upgrade, price hasn’t fell below the support, and today actually bounced off it cleanly. Not to mention the bounce off the uptrend trendline.
So far the price action stays positive for Monero. As long as the support level is being respected, XMR/BTC will either consolidate or continue trending upwards. The consolidation should be confirmed upon the rejection of the btc 0.018600 resistance that is 61.8% Fibs.
Upon the price breakout above this resistance, Monero is likely to travel further north, aiming at the key resistance area near btc 0.002 psychological round number. Namely; 78.6% Fibs at btc 0.020088 or 88.6% Fibs at btc 0.020977.
Currently RSI oscillator remains below the downtrend trendline, which makes Monero buying opportunity very risky at this time; disregarding the fact that the support is holding. Perhaps more time is needed for XMR to reveal its’ price development plan.
Talking about the risk, if the support will be penetrated, with a clean daily close below btc 0.015627, Monero might be forced to go lower, hitting either btc 0.014800 (78.6% Fibs) or btc 0.014230 (88.6% Fibs).
Briefly, fundamental news are extremely positive for Monero, although investors didn’t react on it. Perhaps market is still digesting the news and as long as the support is holding, price is likely to rise.
Support:
1. 0.015756
2. 0.014800
3. 0.014230
Resistance:
1. 0.018594
2. 0.020088
3. 0.020977

XMR Monero Long-termshort term is questionable... might get lucky and get another retest of the long-term support. dollar cost averaging in seems like it's the play as long-term looks bright. Monero becomes VERY deflationary in 2020 (even more so than Bitcoin) and the vast vast majority of coins are accounted for by then. Can imagine worldwide widespread Monero mining "viruses" or massive botnets to take off eventually. trusted privacy option.


#MONERO #BITCOIN #BITCOINPRICE #TRADING #BITDHARMAPrice needs to finnish the pattern to know the next move. If it breaks the support then the trend will be bearish, but if it breaks the resistance the trend will be bullish.

A trading opportunity to buy in XMRBTCTechnical analysis:
. MONERO/BITCOIN is in a range bound and the beginning of uptrend is expected.
. The price is below the 21-Day WEMA which acts as a dynamic resistance.
. The RSI is at 40.
Trading suggestion:
. There is a possibility of temporary retracement to suggested support zone (0.0160 to 0.0151). if so, traders can set orders based on Price Action and expect to reach short-term targets.
Beginning of entry zone (0.0160)
Ending of entry zone (0.0151)
Entry signal:
Signal to enter the market occurs when the price comes to " Buy zone " then forms one of the reversal patterns, whether " Bullish Engulfing ", " Hammer " or " Valley " in other words,
NO entry signal when the price comes to the zone BUT after any of the reversal patterns is formed in the zone.
To learn more about " Entry signal " and the special version of our " Price Action " strategy FOLLOW our lessons:
Take Profits:
TP1= @ 0.0172
TP2= @ 0.0180
TP3= @ 0.0191
TP4= @ 0.0211
TP5= @ 0.0220
TP6= @ 0.0232
TP7= @ 0.0249
TP8= @ 0.0262
TP9= @ 0.0296
TP10= @ 0.0320
TP11= @ 0.0341
TP12= Free

Multiple Bearish Signs for XMRBTCOur hopes for a breakout from that bull flag pattern last week were crushed on the 11th, when Monero broke down against BTC. We sliced through both the 100 day MA, and the 50 day MA as if they weren't there. The upper anchor to our Fibonacci levels provided little support, and currently we are lucky to find some support at the 0.786 Fibonacci at 15649.
We are likely to seek relative lows at 13876 again at some point, because there really is no indication of a turnaround here. If so, XMRBTC needs to first penetrate several Fib levels along the way, including 15107, 14727 and 14346. If we are going to see any resistance to this precipitous decline, it will be at these levels.
It is doubtful we will see any upside momentum outside of a short covering rally. The fact that we are under both the 100 and 50 day moving average is very ominous and these will provide significant resistance in the future. We'll also have to face the upper anchor of our Fibs again. What once provided support will now provide resistance at 16339. We'll see more resistance at subsequent levels at 17209, 18331, but it will be a Herculean effort for BTCXMR to make it back to 17209, let alone consider anything further.

XMRBTC (W): Monero 2014 - 2020 logarithmic view ...Currencies with high privacy could be the biggest winners in the future.
Here a complete overview of Monero (XMR) since the start of the currency.
There are analysts who see Monero (XMR) at over 15.000 USD in 10 years.
Let's see what happens. Happy trading. :-)

XMRBTC BUYWait for the price hit the bottom of the pattern and watch strong price action for buy.
Don’t take a trade if you don’t see clearly when big guys are in.
Forex signals premium channel. Join us!
t.me
