XMR - Monero / BTC Showing Signs of Life - Part 4Monday 11th April 2022
Welcome privacy advocates. Monero Champions
It has been a consolidatory sideways weekend for BTC, but a great weekend for Monero in terms of BTC price.
On the 2 day chart we are at a green TD 8 count.
We have green TD count up dots below all bars and achieved a qualifier "Q" bar on the TD 7
7 and 8 wicked up to just below the 1.272 fib extension of 0.005814
With 1 day and 17 ours to go on the 8 and 2 full days for the 9 to perfect, we could see price continue to more up towards the 0.006035 area, at the 1.414 fib extension
All MA's are below the price now, 33, 88 and 147 day.
Tenkin is still above Kenjun line
Price is well above the Tenkin line
Volume is looking good.
The top of the Ichimoku Cloud is sitting at 0.004958
33 and 88 day MA's are curling up into the cloud
If we see price pull back, between the 33 day and 147 day MA's look good, 0.004456 - 0.004913
Money flow is still green, but has not crossed the zero line. It should cross positive once this candle has closed out. Which where, historically, it has reverted back and flipped negative again, traders taking profits back into BTC.
Squeeze momentum has been strong, staying green for quite sometime now. It faded to a dark green, an over the last 6 days has gained strength going bright green and rising strongly. The previous high in squeeze momentum was on the 15th January where price hit 0.005384.
On the second Bad Ass Bollinger Band chart I will link to this, TD resistance dots are sitting at 0.0061
Money flow has flattened and the price volume oscillator is still not in overcooked territory, and still rising sharply.
There will more than likely be a pullback between current price of 0.005700 and 0.0061
Let's see where it goes privacy freaks! 1 CPU, 1 vote1! Random X's all the way!
XMRBTC trade ideas

XMR is to outpace Bitcoin in the short termXMR-BTC has bottomed out in mid Feb already. Since, it has had a single major thrust upward which has cleared most of the previously established resistance.
Now it is basing again as market market keep accumulating. Expect a violent move up by the end of the week.

XMR - Monero / BTC Showing Signs of Life - Part 3Friday 8th April 2022
Monertopia kicks off this week
Monero has been moving higher
Monero punched through the Upper Orange Bollinger Band, last month on the 7th.
She has broken out of the yellow triangle I drew, on a strong looking TD 7 green candle.
But previous to that, she has not gone passed it since 19th April to 20th May 2021, 1 year ago.
The most recent high's of 0.005398 in 17th January 2022. This will act as resistance, which I have drawn as the solid red line, as well as the TD resistance pink dots just above at 0.006218
If we can surpass to most recent high of 0.005398, and close above, this will be a strong sign for Monero going forward in my opinion.
On the weekly, we should have another two weeks of upward price action if the TD count is to be perfected.
MACD has been bright green for 4 weeks
Money flow is still rising green, but has not crossed the zero line as yet, sitting at -0.091221
Volume and Price Oscillator is not overcooked yet, still in the light orange zone, when it hits the dark orange zone, it will be time to get cautious and take some profits. Let's see if the indicator triggers a sell signal
Let's see where it goes you privacy freaks!
Giddy up!

Monero (XMR) formed bullish Gartley | A good long opportunityHi dear friends, hope you are well and welcome to the new trade setup of Monero coin (XMR) with BTC pair.
On a 4-hr time frame, XMR has formed bullish Gartley pattern.

XMRBTC10x on offer if we extend to the 1.618
not off the cards by anystretch imo
couldnt be more fundamentally bullish on privacy rn

XMRBTC Repeating Bottom FormationRepetition of this same double bottom formation can be seen (arrows)
As price has moved out of 2.618 currently this can spur major price growth, as price is 'free' from the last fib area
This is also demonstrated with .382 acting previously as a resistance, which has turned support
XMR has the potential to act extremely bullishly

XMR - privacy is soon to break out !!MONERO has been in a bear market for a long time against Bitcoin !
This is about to change soon.
I noticed a fractal that points to the last great bull market in 2015 - 2018.
At that time XMR made a 900 X move.
Will history repeat ? Not sure but set up looks quite similar.....
MONERO in the four five digits XX'XXX is not out of reach !!

Will this Big Support HODL ?Inflation rate of monero vs bitcoin seems to favour a bounce at those levels.
Nevertheless Monero might be losing it's network effect towards Bitcoin.
But when it comes to nominal prices (XMR/USD) I am bullish siven the Stock to Flow of Monero.

XMRXMRBTC is going to match what I said about XMRUSDT. XMRBTC is on a flag where it hears a strong bull movement and now it has started taking profit. when we break this flag we will see btc losing over XMR.
DISCLAIMER: Please note that my studies portray my personal opinion only and should be considered for educational purposes only. They should not be considered as a recommendation to buy or sell an asset!
I am not responsible for any damages to your capital. Your capital is at risk in the equity market.

XMR/BTC moving! short-term cup & handle - 0.0063 targethello and happy new year! I have a good feeling about 2022 for monero holders.
this is just a simple short-term idea I saw on the smaller charts. looks like a cup and handle that could take us to 0.0063 if we hold 0.005. cheers everyone.
I am not selling even if we hit this target.


XMR - Monero / BTC Showing Signs of Life - Part 2 (2nd Chart)Chart with the additional indicators from the previous post comments.

XMR - Monero / BTC Showing Signs of Life - Part 215/01/2022
XMR - BTC
Since the 2nd it did not follow the path I suggested, but it did retrace as I suggested back to he sweet spot between 23% and 38% fib.
On the fib, chose 0% because of the green TD support dots
The 7 and 8 TD counts hit a low of 0.004364 and 0.004347 respectively.
Then the no.2 TD on the 13th Jan ripped up to 0.005392 for a 23% gain from the low.
Today on the 3 count with another 3 hours to go, it could go up from here as it is still early in the count, a hammer candle is forming, but the price action is not deviating much which could indicate indecision.
It would be nice to see Monero cross up into the orange 0.005529 Bollinger Band, and crossing up into the red 0.005852 BB would be super!
Monero has crossed the green TD support level at 0.005190, and is staying above at this stage.
The next level of resistance is at the pink TD resistance dots at 0.005750.
If Monero continues to rise, it could top out at the ~0.005600 area, if it does not punch through the resistance.
MACD has crossed bullish.
SuperGuppy is looking positive
Squeeze Momentum is on the second bright green bar
Money flow has crossed negative, and showing red, but appears to be forming a higher low
PZO/VZO is showing as being overbought, but the volume line is above the price line and they are still in the lower orange zone, and have not entered the red zone as in the previous green TD 8 on the 1st January.
Lets see where Monero takes us. Privacy all the way!

XMR/BTC long-term resistance flipped support and double bottomAs you can see, the resistance levels of 2015/2016 have turned into support in 2021. Then, throughout all of 2021, it formed a huge double bottom right on that support. The higher the timeframe on these kinds of moves, the more accurate they turn out to be. Considering we had a big green daily candle yesterday, I'd say it's very likely that this was the bottom and we go up big time from here. As I mentioned in my other post, targets range from 67000 sats (~$300 - 350) all the way up to 500000 sats (~$2000 - 4000+ depending on where BTC is at that time). XMR is generally pretty stable so it should be an easy hodl. We're just waiting to see if the 4 year long downtrend finally reverses here. There's no guarantees, but if that trend finally reverses it's going to be wild.

XMRBTC Horizontal Support & Resistance LevelsWatch for price action signals at these horizontal levels.

XMR/BTC following the fibs. Also macro bullishI expect XMR/BTC to touch the 0.618 fib at 0.004678btc within a couple of hours from now before bouncing and making a new high in a couple of days max. On the macro scale (the 1w) we can see that the resistance of 2015/2016 has flipped to support in 2021. We also have a huge double bottom that formed during the year 2021 and now a strong bounce. On the daily we can see that it has tested the 200d MA and rejected it. A retrace was to be expected here, but follow this fib and buy pretty much anything under 0.0048btc. First real target is at $315, after that it gets crazy and the sky is the limit. However insane it sounds, we could even see XMR at 0.05btc within a year, which would bring it over $4000 if Bitcoin is above $80k by that time.

MONERO(XMR)/BTC KINGHi all
I share my prediction for Monero - weekly chart
so we can see nice double bottom+ convergence in RSI
if neck line brake we can see over 50 percent profit up to next resistance and double bottom target
dont forget to follow and like if you agree with me.
Not financial advice
PLEASE DO YOUR OWN RESEARCH
Good luck
BINANCE:XMRBTC

Monero / BTC Showing Signs of LifeHey every body. Happy New Year!! Hope you all had a great one!
So from my last published idea, Monero did rise up from the ashes showing signs of life, which was great to see.
So if any one out there bought at the recent low and sold at the high of 0.005331, that was nice 40% gain.
On the 9th candle it did pull back. So let's see where it goes from here. There could be another 4 days of positive price action, which would be really nice to see.I am hoping to see it go to the 1.414 Fibonacci level of around 0.005877, then pull back, eventually to the 23% to 38% Fib level, and then head north again, slowly but surely as indicated in the path drwan on the chart. And in light of the weakness seen in BTC lately, this is a possibility.
The 33 day and 88 day MA's will be crossing over in the next few days which will be another positive sign for Monero.
Not shown on this chart, on the Daily, CMF (Money Flow) indicator is bullish and is on the positive side of the zero line, but appears to have peaked. On the weekly, CMF is still below the zero line, but is heading north still. Squeeze Momentum has had 7 days of strong bright green shoots. Ichimoku has flipped green and Tenkan has risen above the Kinjun line. And the lagging span is well above the cloud and the Tenkan Kinjun lines.
Overall this is a positive for all supporters of this project, and those that believe strongly in privacy.
Let me know what you think.
Freedom or Death.

XMRBTC Target Price 0.005504XMRBTC. Watch Price Level 0.005320 for a bullish price action single for a long entry.


Watch Monero in the Months AheadInteresting notes on Monero bottoming vs Bitcoin. There is a double bottom which features a higher low.
On each bottom, the structure is similar. On first botttom, the time between the initial low, and the last low was 62 days. On the second bottom, the time between the initial low and the last low was 60 days.
Also of note, if you zoom way out, these lows of 2021 are still higher than the lows of 2015. In the weeks ahead, let's see how Monero progresses. There is a path for 4 digit Monero in the months ahead. WEF Great Reset positioning for some.

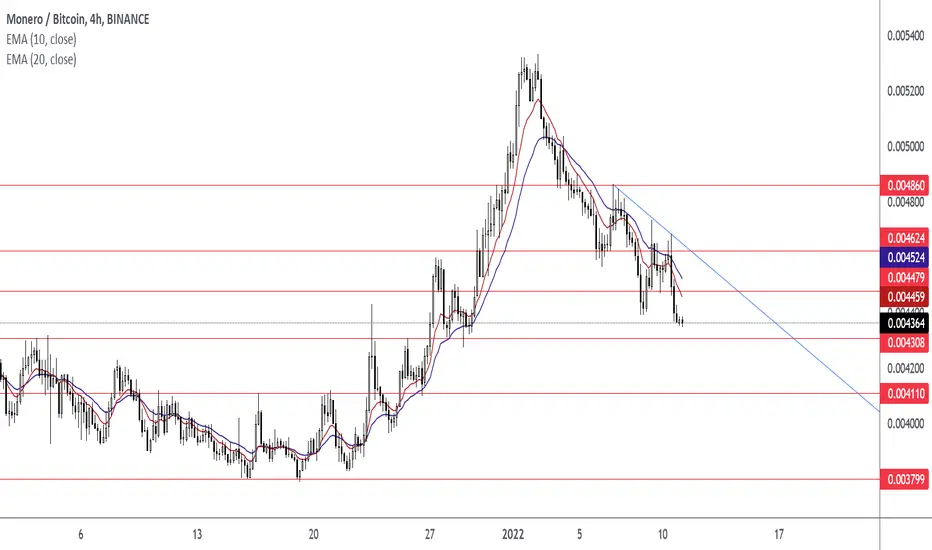
XMRBTC Target Price 0.005000XMRBTC Horizontal Support Resistance Level, EMA 10, EMA 20, and Rejection Candlestick.

Monero/Bitcoin, is this accumulation?I'm an absolute noob, so no idea what I'm doing but wanted to play with the wyckoff schematic. From the tutorials:
Springs or shakeouts usually occur late within a TR and allow the stock’s dominant players to make a definitive test of available supply before a markup campaign unfolds. A “spring” takes price below the low of the TR and then reverses to close within the TR; this action allows large interests to mislead the public about the future trend direction and to acquire additional shares at bargain prices. A terminal shakeout at the end of an accumulation TR is like a spring on steroids. Shakeouts may also occur once a price advance has started, with rapid downward movement intended to induce retail traders and investors in long positions to sell their shares to large operators. However, springs and terminal shakeouts are not required elements: Accumulation Schematic 1 depicts a spring, while Accumulation Schematic 2 shows a TR without a spring.
Test—Large operators always test the market for supply throughout a TR (e.g., STs and springs) and at key points during a price advance. If considerable supply emerges on a test, the market is often not ready to be marked up. A spring is often followed by one or more tests; a successful test (indicating that further price increases will follow) typically makes a higher low on lesser volume.
Again, no idea, I was just looking at the schematic and it reminded me of xmr/btc a bit.
