Monero: Bounce at .014BTC, target .02BTCMonero is crazy. But it's also one of the few cryptos that people actually buy stuff with, and being ~#13 on the market cap, it's fundamentally one of the better cryptos to invest in. (If that's your thing). Reading the Monero chart is difficult, because its extremely volatile, even for a cryptocurrency, and it doesn't follow Fibonacci levels, which kind of makes sense because the people who use Monero are on drugs. However, several patterns do emerge: 1) A
tendency to double bottom, 2) A general uptrend against Bitcoin, and 3) Huge profit potential.
I'm looking for a bounce at .014 up to .02, and what happens after that depends on the crypto market as a whole.
What do you think of XMR? Share your ideas below.
XMRBTC trade ideas

Monero breaks the triangle downMonero has broken out of the triangle after a consolidation period. The coin has pushed through the trend line support and closed below it. In a perfect manner, it returned back to support, now resistance, touched it and rotated back lower. In these scenarios, the price action usually goes and at least tests the previous swing low, but also prepares a ground for the new set of lows. The bias, in this case, is clearly bearish as traders are looking to sell any bounce, as it happened with the re-test of the trend line. If we continue lower, watch out for a test of the 161.8% support zone around 0.01500. If, on the other hand, we brake into the previous triangle again a test of the previous swing low around 0.01700, now resistance, coupled with the 200 MA, is highly likely.


XMR // BTC // Patron BAT / listed in COIN BASE ??xmr btc -5.70% is forming a BAT pattern that matches levels of supports
bull area
and the news that the base coin would incorporate one of the currencies in the list
Greetings friends ..
there are always good opportunities

XMR/BTC Short ScenarioTimeframe: 30M
Main Scenario: Maybe we'll have another selling opportunity if the rate will stay below the 50% Fibonacci line of the descending pitchfork and if it will make a valid breakdown below the lower median line (lml) of the ascending pitchfork. You should wait for a valid breakdown from the ascending pitchfork's body to be sure that the rate will drop significantly again.
Alternative Scenario: Price could continue to increase within the ascending pitchfork's body and could approach and reach the UML and the outside sliding line (SL) of the descending pitchfork.
Entry/Stop Loss/ Take Profit: Maybe you can go short from 0.015804 level and you can place a Stop Loss at 0.016119 level. The Take Profit could be placed at 0.014964.
Duration: 5-7 days
Consolidation/Ratification level: You should drag the Stop Loss below the opening price only after a valid breakdown below the median line (ML) of the descending pitchfork.
Warning Level: You should be very careful because a failure to reach the median line (ML) could signal an oversold and a potential upside movement.
Risk Management: Risk/Reward Ratio: 2.67

MoneroBTC: 3 crucial info. to keep in mindThe 4 hour timeframe chart of Monero (XMRBTC) is shown in this analysis with commentary provided below based on the numbers marked on the chart.
(1) Price action in Monero from April 20, 2018 to April 26, 2018 formed the right shoulder (rs) of a head and shoulder top pattern in Monero, which progressed into the bearish channel.
The bear channel has contained price action ever since, and is therefore important to pay attention to for Monero (XMRBTC). Price closing outside of the channel is a great opportunity to enter long trades if confirmed by bullish momentum. Other less conservative approaches to going long (buy) would seek to buy XMRBTC prior to price action breaking to the upside of the channel.
(2) Support region which is between ~0.01491 and 0.01175 is anticipated to provide an entry opportunity into a long (buy) position. The bottom of the current bear channel does coincide with the lower region of support i.e. 0.01175, which therefore increases the chance of price action finding support in the mentioned region above.
(3) The relative strength index (RSI) currently has a downward slope, which indicates the chances of price continuing its path downwards to the support region. The conclusion therefore for this analysis is that Monero (XMRBTC) is in a downtrend (sellers market), and any long (buy) position requires patience for bullish momentum to resume.

Monero[XMR] 80%+ short term Profits OpportunitySince May, Monero has been in an elliot correction wave. It seems the end for this correction is almost here and we did see an engulfing candlestick yesterday. Besides this its almost shaping out to form a falling wedge and it seems its almost on the end of forming a pattern.
Entry Level : 161000 sats - 166000 sats
Stop Losss 134000 sats
Possible Targets :
T1 : 194020 sats
T2 : 217710 sats
T3 : 236860 sats
T4 : 256010 sats
T5 : 283270 sats
T6 : 318000 sats
Good Luck.
Legal disclaimer:
Information on this channel is our team's analyst's "opinion" based on data available at this point in time. These opinions are not recommendations to buy or sell securities/commodities and cryptocurrencies. Trading and investing is a risk and you should not rely on this data to make any financial decisions. You must consult a financial advisory licensed by regulatory agencies in your legal jurisdiction. All information stated here and in our reports don't guarantee any possible profits or losses. Please do consider to do your own due diligence and research when making any kind of a transaction with financial implications. With Regards. TeamTWA.

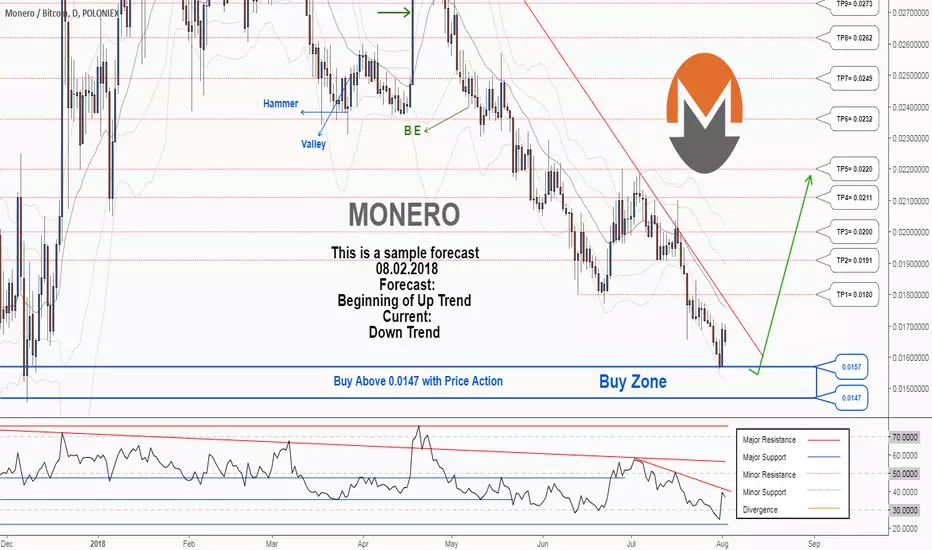
There is a possibility for the beginning of an uptrend in XMRBTCTechnical analysis:
. MONERO/BITCOIN is in a downtrend and the beginning of uptrend is expected.
. The price is below the 21-Day WEMA which acts as a dynamic resistance.
. The RSI is at 37.
. While the RSI and the price downtrend in the Daily chart are not broken, bearish wave in price would continue .
Trading suggestion:
. There is a possibility of temporary retracement to suggested support zone (0.0157 to 0.0147). if so, traders can set orders based on Price Action and expect to reach short-term targets.
Beginning of entry zone (0.0157)
Ending of entry zone (0.0147)
Entry signal:
Signal to enter the market occurs when the price comes to "Buy zone" then forms one of the reversal patterns, whether "Bullish Engulfing" , "Hammer" or "Valley" in other words,
NO entry signal when the price comes to the zone BUT after any of the reversal patterns is formed in the zone.
To learn more about "Entry signal" and the special version of our "Price Action" strategy FOLLOW our lessons:
Take Profits:
TP1= @ 0.0180
TP2= @ 0.0191
TP3= @ 0.0200
TP4= @ 0.0211
TP5= @ 0.0220
TP6= @ 0.0232
TP7= @ 0.0249
TP8= @ 0.0262
TP9= @ 0.0273
TP10= @ 0.0304
TP11= @ 0.0320
TP12= Free


#MONERO #BITCOIN #BITCOINPRICE #TRADING #BITDHARMAProfit targets:
- 17000 Sats
- 17900 Sats
- 19000 Sats
- 20000 Sats

Monero - Poop and Scoop incoming on the way to Finding Bottom?IMO we see bottom on the xmrbtc pair between 0.011 and current levels. An overthrow to below .01 could come to pass for a brief period.


Monero looks weak for the remainder of 2018Tough times ahead for Monero. Long term supports at .02 and .014 are possible in the intermediate term.
