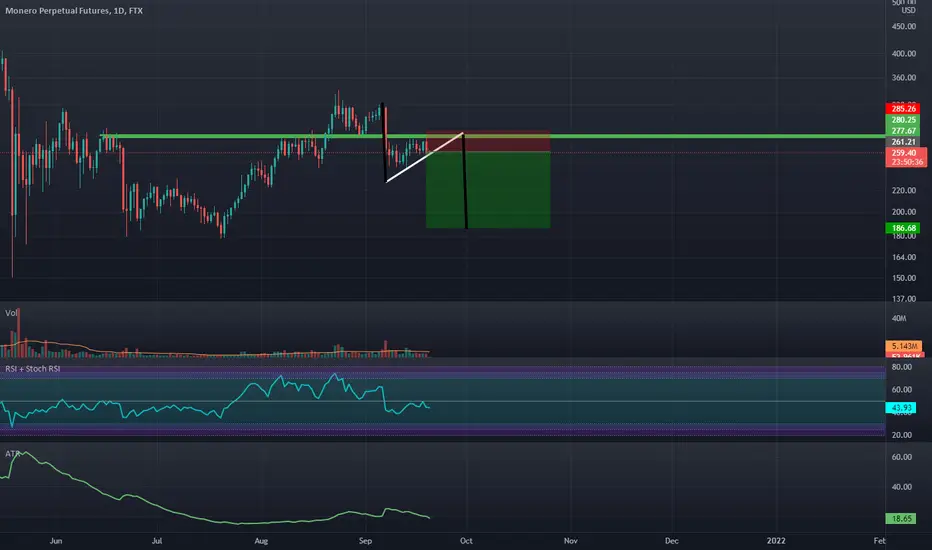
Bearish Engulfing On Daily Under An Important LevelWe are under support and the RSI is under 50 and looks to be ready to go down lower i think we will see $200-$180 again.
XMRUSD trade ideas

Super Long Term Bull for MoneroTitle says it all. Potential long term play for $XMR. I would love to see a slight pull back first but then switch mega bull. Not saying we get to 5 digits right away but over a decade perhaps. Will play the swings.

XMR long again to the weekly level 315.05Same as my previous trade entry, but to the weekly level, should be a winner while bitcoin looks to move to 39k

XMRUSD H8: 150% gains // Best level to BUY/HOLD IT (SL/TP)(NEW)Why get subbed to me on Tradingview?
-TOP author on TradingView
-2000+ ideas published
-15+ years experience in markets
-Professional chart break downs
-Supply/Demand Zones
-TD9 counts / combo review
-Key S/R levels
-No junk on my charts
-Frequent updates
-Covering FX/crypto/US stocks
-before/after analysis
-24/7 uptime so constant updates
🎁Please hit the like button and
🎁Leave a comment to support our team!
XMRUSD H8: 150% gains // Best level to BUY/HOLD IT (SL/TP)(NEW)
IMPORTANT NOTE: speculative setup. do your own
due dill. use STOP LOSS. don't overleverage.
🔸 Summary and potential trade setup
::: XMRUSD 8 hour/candle chart review/outlook
::: very strong chart accumulation
::: since January 2019. bottom in place
::: expecting short-term gains BUT
::: PULLBACK soon / buying opportunity
::: for BUY/HOLD traders
::: almost 150% gains possible
::: get ready to BUY/HOLD after pullback
:::190/200 USD best RELOAD BULLS
::: recommended strategy: BUY INTO PULLBACK
::: TP BULLS 500+ USD.
::: 150% upside for bulls
::: BUY/HOLD setup for patient traders
::: just BUY low and get paid, period
::: good luck traders
::: details: see chart
🔸 Supply/Demand Zones
::: N/A
::: N/A
🔸 Other noteworthy technicals/fundies
::: TD9 /Combo update: N/A
::: Sentiment mid-term: BEARS/PULLBACK
::: Sentiment outlook short-term: BULLS
RISK DISCLAIMER:
Trading Crypto, Futures , Forex, CFDs and Stocks involves a risk of loss.
Please consider carefully if such trading is appropriate for you.
Past performance is not indicative of future results.
Always limit your leverage and use tight stop loss.

XMR to 380Having regained the 236 of the drop, XMR moves between the key support and the 382. It is merely a matter of time until it touches the 618 key level.
Easy long

XMR to retrace the pump XMR will retrace the pump once it exits and closes above the range high. Easy set up with clear invalidation below

Ascending triangle PatternPrice rising steadily, made to support levels
Safe time to buy and catch 10 points


Monero XMRUSD - Road to 3000 USD + Cup and Handle!- It is a right time to buy Monero, because of the cup and handle formation!
- Target is 1:1 fib trend-based extension - in next leg up, so be prepared.
- RSI is ready for a pump and once we reach all time high, we should accelerate in speed.
- For expected duration of the trade, probability, stop loss, profit target, entry price and risk to reward ratio ( RRR ) - please check my signature below ↓
- If you want to see more of these ideas, hit "Like" & "Follow"!

XMR/USD Bulls Couldn’t Give Up Now!Monero Price Analysis – August 30
At the moment, the Monero price faces the positive side as the bulls aim to drag the market price to the resistance level of $342.
XMR/USD Market
Key Levels:
Resistance levels: $341, $350, $390
Support levels: $243, $230, $210
XMR/USD price is now trading close to $320 as it hovers around the $315 resistance level at the time of writing. The Monero price could move upwards if the crypto crosses above the upper boundary of the channel. However, XMR/USD may hit the resistance level of $341 if the bulls focus on the uptrend.

MONERO:Are we facing a new Pullback?Welcome back Traders, Investors, and Community!
Check the Links on BIO and If you LIKE this analysis, Please support our Idea by hitting the LIKE 👍 button
Traders, if you like this idea or have your own opinion about it, please write your own in the comment box . We will be glad for this.
Feel free to request any pair/instrument analysis or ask any questions in the comment section below.
Have a Good Day Trading !

Monero, Bearish Wave-Count To Approach Pivotal Zones!Hello,
Welcome to this analysis about Monero, we are looking at the 4-hour timeframe perspectives. Monero in recent times initiated a bearish reversal after pulling back of the 335 resistance bearishly. The pullback reaction seen here was somewhat stronger than the one seen in other cryptocurrencies especially the highest market-cap ones like Bitcoin or Ethereum as well as other altcoins, this shows how the divergence between the currencies is increasing and therefore Monero has an increased bearish edge at the moment compared to the other currencies omnipresent in the market. As when looking at my chart now we can watch there how Monero pulled to the downside bearishly to test the 292 Usd Level and it is possible that here comes a little bounce to the upside however as Monero has this strong local resistance within the structure marked in my chart in red there is a high likelihood given that Monero pulls back bearishly from this resistance to continue its wave-count to the downside and emerge with the wave C in the structure as shown in my chart, this wave C will continue till appropriate support has been reached which is given within the considerable back-up-structure marked in blue where a bounce and back-up can show up, in this case, it will be crucial on how strong this bounce will be and if Monero manages to stabilize further above the structure to move on higher because when this does not happen and Monero increases bearishness to move below this zone it will lead to a bearish continuation within the bearish-continuation-zone and Monero will emerge with the wave-C-extension. For now we should expect the bearish developments to spread further and keep prepared for these possibilities.
In this manner, thank you for watching my analysis about Monero and its main structure with incoming bearish pullbacks and its determinations to expect, support the analysis with a like and follow or comment for more market insight!
"Astonishment is the basis of reverence."
Information provided is only educational and should not be used to take action in the market.

Monero (XMR/USD) 1D: Elliott Wave Analysis (Update)👋 Hello and welcome traders to another trade idea with SunnyHillCapital
☝️ Firstly, if you like what you see, please support our work by writing a comment and SMASH that like button! 👍 Let's catch these moves together! ✅
💡 Why should you follow our profile on TradingView?
Consistent chart updates
Clean charts
Short and long-term perspectives
Visually teaches you valuable lessons
High probability setups
Analysis on a wide range of major markets
SMASH that follow button! 👍
💡 Leave a comment and/or message us on how we can improve and provide better content, we are open to suggestions to create a better experience for you!
Keep in mind that the analysis provided is not 100% accurate and that you can never be certain with the markets. This information given is not financial advice, always do your own research.
Thank you for reading,
Cheers to many pips! 🤝

Monero (XMR/USD) 2D: Elliott Wave Analysis👋 Hello and welcome traders to another trade idea with SunnyHillCapital
☝️ Firstly, if you like what you see, please support our work by writing a comment and SMASH that like button! 👍 Let's catch these moves together! ✅
💡 Why should you follow our profile on TradingView?
Consistent chart updates
Clean charts
Short and long-term perspectives
Visually teaches you valuable lessons
High probability setups
Analysis on a wide range of major markets
SMASH that follow button! 👍
💡 Leave a comment and/or message us on how we can improve and provide better content, we are open to suggestions to create a better experience for you!
Keep in mind that the analysis provided is not 100% accurate and that you can never be certain with the markets. This information given is not financial advice, always do your own research.
Thank you for reading,
Cheers to many pips! 🤝

Monero XMRUSD - Weekly cup and handle! + New ATH +1000% gains!- It is a right time to buy Monero, because of the cup and handle formation!
- Target is 1:1 fib trend-based extension - 1000%! in next leg up, so be prepared.
- RSI is ready for a pump and once we reach all time high, we should accelerate in speed.
- For expected duration of the trade, probability, stop loss, profit target, entry price and risk to reward ratio ( RRR ) - please check my signature below ↓
- If you want to see more of these ideas, hit "Like" & "Follow"!

XMRUSD BULLISHXmr has officially turned into a buy on the Daily time frame and is ready to go up some more!!! Going for 300 first, then my final TP is 311.

XMR Sell a break setup.XMRUSD - Intraday - We look to Sell a break of 253.8 (stop at 260.1)
Bearish divergence is expected to cap gains.
Pivot support is at 254.3.
A break of bespoke support at 254, and the move lower is already underway.
A lower correction is expected.
Although the bulls are in control, the stalling positive momentum indicates a possible turnaround is possible.
Our profit targets will be 235.5 and 230.5
Resistance: 265.0 / 270.0 / 275.0
Support: 260.0 / 254.0 / 250.0

Monero XMRUSD - Weekly cup and handle! + 1000% gains!- It is a right time to buy Monero, because of the cup and handle formation!
- Target is 1:1 fib trend-based extension - 1000%! in next leg up, so be prepared.
- RSI is ready for a pump and once we reach all time high, we should accelerate in speed.
- For expected duration of the trade, probability, stop loss, profit target, entry price and risk to reward ratio (RRR) - please check my signature below ↓
- If you want to see more of these ideas, hit "Like" & "Follow"!

XMRUSD OpportunitiesXMRUSD remains bullish as structure keeps creating higher highs and higher lows. Look around the marked areas for 4 hour candles rejections. As long as price respects marked area, buy opportunities could be taken.

