XMRUSD Buy SignalPattern: Bullish Megaphone on 1D.
Signal: Buy as the LMACD just formed a Bullish Cross (previously a sign of an upcoming rise within the Megaphone).
Target: 260.00 (just below the 1.5 Fibonacci extension).
Most recent XMRUSD signal:
** Please support this idea with your likes and comments, it is the best way to keep it relevant and support me. **
--------------------------------------------------------------------------------------------------------
!! Donations via TradingView coins also help me a great deal at posting more free trading content and signals here !!
🎉 👍 Shout-out to TradingShot's 💰 top TradingView Coin donor 💰 this week ==> TradingView
--------------------------------------------------------------------------------------------------------
XMRUSD trade ideas

Monero- new money maker?New opportunities after a short vacation, wolves🔥
Well..well..well.. today we have a new formation on XMR/USD. Cup and Handle pattern with strong bullish trendline on bigger frame. Everything is like on a book about trading. Lets follow the chart and look for a breakout. Planning to enter into this trade with bigger volume than usual.
If you enjoy my FREE Technical Analysis, support the idea with a big LIKE👍 and don't forget to SUBSCRIBE my channel, you won't miss anything!
Feel free to leave comments✉️

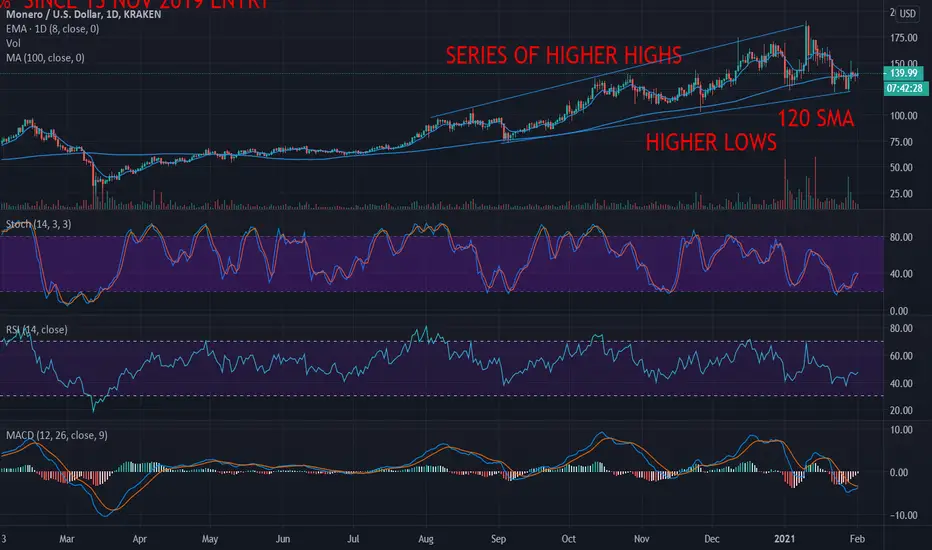
MONERO: THE BIRD ON THE WIREMonero (XMR) looks to be sitting pretty at $141 which is just above its 100 day simple moving average (SMA), now $137.91. The 100 SMA has provided solid support for XMR since it was tested in June 2020. XMR's bullish price trend has seen a series of higher highs and higher lows over the past 6 months.
Monero reached a recent high of $190.22 on 10 January of this year. We have seen a pullback to the 100 SMA after that high. XMR is currently 25.80% off that recent top and therefore looks interesting here.
Furthermore, Stochastics were in the oversold region last week and now appears to be confirming a reverse in trend. MACD looks to be on the cusp of turning positive and the RSI is the final indicator which is improving and at the 48 level, closing in on the 50 level. A cross of the 50 RSI would confirm this bullish set-up.
She is perched on the wire and ready for takeoff. Long XMR since November 2019.
Monero Discounts Incoming! (XMR)Monero has been in a rally for around 300 days.
We brokeout past the recent high of $100 and now I believe we are setting up for a good size pullback.
I have my eyes set on a catch at $100 as a potential major breakout retest, the we will bounce towards the ATH.
My ema dots indicator on the bottom is showing a red dot which is a sign for sell off. The week will close in 1 day which will help me confirm on trend. The candle above is showing compression with sideways movement, with price shifting below the candle.

XMR/USD 1W 💲 XMR/USD
🕔 Mid Term / 3 to 6 months
🛑 Stop loss NOT NEEDED
💵 Recommended Investment : 5% of portfolio


XMR formed Cypher pattern for upto 40.5% bullsih rally
Hi friends, hope you are well, and welcome to the new update on Monero.
On the weekly chart, the price action of the XMR has completed the final leg of bullish Cyhper and entered in the potential reversal zone. The price action is breaking down the 50 simple moving average but we have another good support of 100 SMA below the buying zone.
Possible profit and loss ratio:
This trade has a profit possibility of 40.5%, and the loss possibility is 10%.
Note: Above idea is for educational purpose only. It is advised to diversify and strictly follow the stop loss, and don't get stuck with trade.
For exact buy and sell targets for this trade, and other harmonic trading signals you can join:
www.patreon.com
XMRUSD it can be a best opportunity to buy the dipHey friends, hope you are well, and welcome to the new update Monero.
On Feb 9, 2020, I shared the idea where the price action of XMR formed a big bullish BAT on the monthly chart, now the priceline has started to move to the upside and so far it has produced more than a 120% rally.
Pivot support and EMAs:
Now if we take a look at the live monthly chart, then it can be observed that the price action also had pivot 1st support below the potential reversal zone that helped well to the priceline to move up. In this rally, the price action has also crossed up monthly exponential moving averages 10 and 21.
Long-term support and resistance levels:
On the weekly chart, the different long-term support and resistance levels can be seen. The price action of XMR has broken out the $100 and $140 resistance levels and re-testing the $140 as support. The next resistance levels would be $140, $260, $330, and $450.
An up-channel formation:
On the same weekly chart, the price action has formed an-up channel and it is re-testing the support of the channel and weekly EMAs 10 and 21 as well.
Ichimoku cloud:
The price action has already broken out the weekly Ichimoku bearish cloud resistance and now re-testing the conversion and the baseline supports.
Another big bullish BAT:
Now if we take a look at the XMR with Bitcoin pair’s 2-month chart, then the Monero has formed another very big bullish BAT and entered in potential reversal zone. This time we again have pivot 1st support beneath the potential reversal zone.
s3.tradingview.com
Conclusion:
The priceline of Monero is re-testing different support levels therefore the re-testing of these supports would be successful then it will be the best buy the dip opportunity.


Crypto is a complete dud and a shamMonero $20 Psychological target in 1 year. Bitcoin and Altcoins will make people's wives leave them.
L1000X Labs


MONERO DAILY CHART- To look for an opportunity in this currency I would wait for the rectangular area. If the price reaches this area, we will look for signs of a possible turnaround, such as an engulfing candle or a double bottom pattern.
- This area is a good investment opportunity, as we can have a great bullish run if the price goes for its historical highs. If the price turns in this area, we can also cover very easily with a stop losse in break even.

MONERO WEEKLY CHARTXMR has broken the accumulation area where it has been since 2019 with a vertical movement and an increase in volume. We can expect the price in the control zone marked as a rectangle,is an area where a lot of volume has been recorded in recent years according to volume and it is possible that the price will make a pullback to this area looking for such volumes. We can see it on the daily chart.

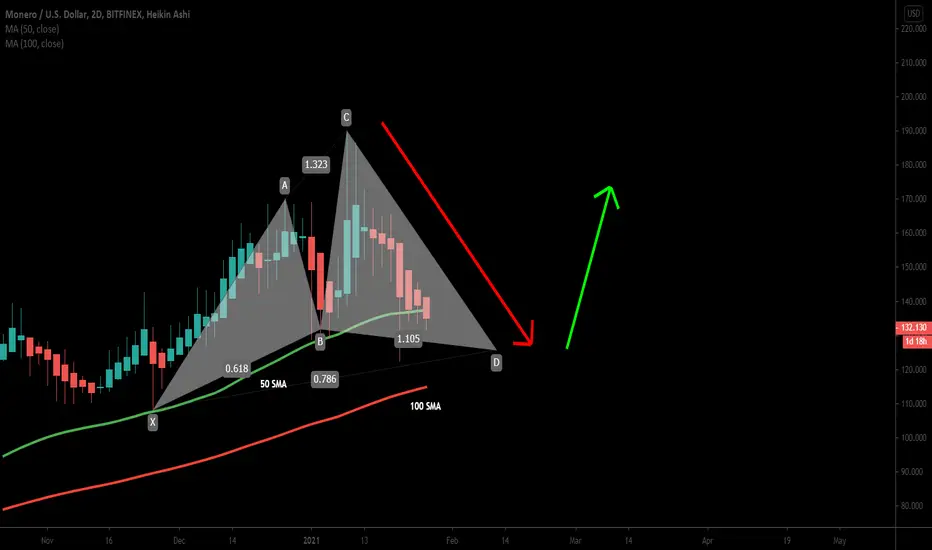
Nice Long Setup!Monero had a nice bounce off my 0.786 fib level and the daily trend line continues to hold as support. Volume has been steadily increasing and BTC dominance is experiencing some temporary weakness which has seen alts making nice gains.

tip: who do care about privacy ?! analysis of Monero... XMRUSD!What is 🌟Monero🌟?
Monero is a secure, private, and evasive cryptocurrency which is first started on April 18, 2014 ,and that uses special encryption to ensure that all of its transactions remain untraceable and evasive .Monero has a circulating supply of 17,815,130 coins and a total market cap of $2,790,931,850 which ranks it at position 15.
In a world of increasing transparency, the reason for the emergence and interest in cryptocurrencies such as Monero can be understood.
Monero uses the proof-of-work algorithm. This means that Monero, like Bitcoin, a mineable cryptocurrency.
The priority of Monero and its community is based on three key values. On the Monero site, these features are defined as follows:
1.Security: Users must be able to trust their transactions without encountering any errors or attacks.
2.Privacy : Monroe values privacy. Monroe must save its users from the death penalty in the courts and in worse cases!
3.Decentralization: Monroe believes in the highest level of decentralization.
------------------------------------------------------------------------------------------------------------------------------
❇️Quick Technical analysis
Monero price now is $156.738 with a 24-hour trading volume of $463,215,010. Monero price reached its all-time high level of $542.33 on January 08, 2018. Monero price is down -0.92% in the last 24 hours and tends to move upwards by 1.45% according to last hour transactions. Also Monero price on a weekly basis increased by 6.06%. When we look at the variation of Monero price monthly, it is down by -2.44%, whereas it is up by 138.80% according to its price 1 year ago.
anyway Based on the monero historical price data, we predict the monero price could be about $450 at the end of the year 2021. Also it could be $197.976 exactly one year later today. In the next 3 years, the highest level monero price could reach is $1158.93 and the lowest monero price could be $96.3110
------------------------------------------------------------------------------------------------------------------------------
👉This analysis is my personal opinion and you are responsible for your own trades or invests.
❤️with Best Regards and successful trades.


XMR = BTC 3.0 (XMR Support/Resistance Zones & Price Targets)Hello Crypto Privacy Advocates!
I love XMR, it is my favorite crypto and in time, I suspect it will surpass BTC in value!
In order for it's market cap and value to surpass BTC's the masses will first need to recognize the necessity for privacy and I foresee that becoming more and more obvious to those with eyes and ears in coming months.
In the coming months, fiat currency may be dissolved, the markets may crash, and the globalists will try to implement their own slave crypto via. the CBDC as a 'solution' to the problem which they created!
Just release ownership of all your possessions (current & future) and we'll give you a UBI and you good to go, bro (I mean slave)!
I mean, come on, really... "You will own nothing, you will have no privacy, and you will be happy.".
What a load of BS, eh!
The Great Reset is upon us, says Emperor Klaus Schwab, the IMF, and the rest of the globalist cronies!
When the masses realize that BTC is digital currency 1.0 and XMR is digital currency 3.0, I suspect XMR and other leading privacy coins will sky rocket!
On the more technical side, if BTC continues its ascent to the moon, then I suspect XMR will quickly head to the next strong weekly resistance zone around $215, then beyond! Price action above $170 will become increasingly volatile, so get ready for a ride!
We can see that XMR is in a weekly uptrend with increasing volume.
Price action is agreeing with volume and this is bullish! I can also see hidden bullish divergence on the 3D chart.
3D stochastics are also coming into an area of strong support. Prior bounces off this area have proven bullish!
#HODL
XMR Support/Resistance Zones
515
400
369
269
215
170
140
115
90
---
Guide to My Charts
-The dark magenta horizontal lines are support/resistance 'zones'. If price pierces though one side of the support/resistance zone, it is likely to head to the next support/resistance zone!
-Yellow lines are typically used to chart out pattern formations and trend lines!
-The colored lines are MAs (Red: 10SMA, Yellow: 21EMA, Green: 55EMA, Blue: 89EMA, Purple: 200EMA, White: 200SMA, Maroon: 377EMA).
-Horizontal white and green lines may be Fibonacci levels. The 0.382 and the 0.618 Fibs are green and the rest are white.
-The Historical Volatility Percentile, RSI , and/or stochastics indicators are below the chart if displayed.
---
Please smash the like and comment if you find value in this post! It helps show me that others are interested and motivates me to share more with the community!
---
Disclaimer:
This is not financial advice; I am not a financial adviser. This information is not meant to be used for financial advice, nor trade ideas. These posts are simply a record of my technical analysis and potential trade setup ideas.
These posts are intended for educational purposes only. It is imperative that everyone conduct their own research prior to entering any trade.

$XMR breaking down from rising wedgeAfter the strong rally of XMR, a correction wouldn't be shocking.
Something to keep an eye out for
EJ - Just for fun

The Last Solid Oldtimer: XMR 2021As the de facto privacy coin of the cryptocurrency ecosystem Monero stands at odds with current regulatory trends.
Yet I see great potential as it will follow BTC & ETH to first break out of it's 40-150$ range towards 300$ and reclaim it's ATH within this year.

monero shortmonero couldn't break the channel before several times of try and now we have exhaustion candle in daily time frame. it's look like too a good short position.
