XMR Buy Signal Weekly IchimokuWeekly buy signal (solid green candle) through the ichimoku cloud has been a clean signal for monero in the past. I wouldn't be surprised to see $100 XMR by the end of March.
XMRUSD trade ideas

XMR - LongAnother coin I'm excited about is XMR, it appears to be completing a bullish bowtie diametric, which should indicate a continuation of it's uptrend. Confirmation is when it breaks the beginning of Wave-E .
Not trading advice.

XMR USD - monero dollarJust as peredicted Monero prices are rising
Don't forget to expect a pullback soon

XMRUSD Buy SignalPattern: Channel Down on 1W.
Signal: Bullish as the Lower High trend line broke. If it fails to get detached from the 1D MA200, then expect a 1 month consolidation first.
Target: 95.000.

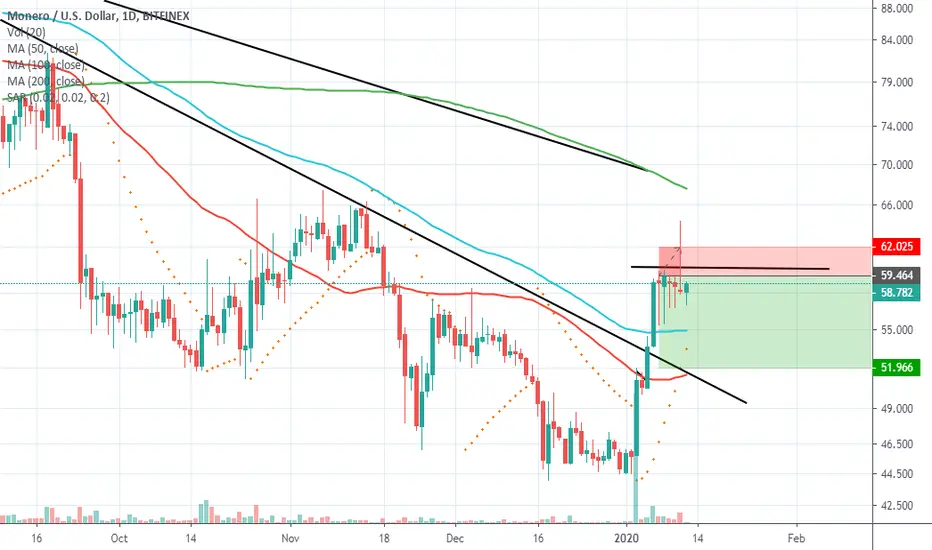
XMRUSD - Buy 14.01.2020Friends, please before reading, support this idea with your Like and any Comment, thanks.
You can buy XMRUSD from 56-52
Stop-loss 49
You will find more trading ideas in SAV Finance community.


Monero shows bullish signals. End of the downtrend for XMR/USDDear Ladies and Gentlemen,
As for EOS as for XMR/USD on the chart you can see breaking up of bearish trend line and signals from our momentum strategies for long trades are coming on the weekly chart.
We suppose it's end of bearish trend for XMR. There is begin of new accumulation for global upmove.
If this post was useful for you - please leave your likes and follow us on social networks! If you don't agree - write your vision in comments.
Best regards,
FOBS Team

Daily Gravestone Doji XMR/USDTight stop incase of a breakout but that Gravestone doji is telling me to short
XMR USD Monero UltimateMonero Monero Monero
The perfect little privacy coin
for illegal transaction and other
cool stuff you wish to hide from Uncle Sam
I say
BUY BUY BUY
but you should investigate
WHY WHY WHY
Peace!


xmrusd 8hour chart best level to buy 60%//120% gain prjsyndicateshort term next 2-4 weeks
bear mode very likely
don't expect gains
best level for buy/hold
traders near 34//40
up to 120% upside
target bulls 34//40.
right now if you want to trade xmrusd
look to short sell any rips.
upside very limited from here.
some other crypto ideas by projectsyndicate
eosusd 8hour best level to buy/hold 100% gain projectsyndicate
btcusd 8hour update by projectsyndicate
ethusd 8hour market update by projectsyndicate
xrpusd best level to buy 40%/80% gain by projectsyndicate
bchusd 8hour best level 100% buy and hold by projectsyndicate

Monero first will go down than ... lets look I think before we start go extremely high it must test 50usd once last time . It is simmilar for another top 10 altcoins situtaions where I predicted a drop on Ethereum for example .
Look also what option could interest You
I am suggesting to invest in altcoin like : UVU (search it by Coinmarketcap or coinpaprika) which is new coin but with bright perspective. Why UVU ? Because their unique vision based on crypto atm and recharge stations for electric cars . This european project got first successes behind them like listing on big Hotbit Exchange - You can trade there without K-Y-C so registration is easy and fast - brilliant model for less experienced users .
Moreover the price is still cheap it means BIG space to grow. Team predicted that price for 1 UVU should be a round 0.2 USD in March and now its just 0.0028 USD !
Also the cirrculation supply isnt big so it also work for future profit because many coins could be in Yours hand for less payment .
Think serious about investition like this !
Also You will help to grow whole market because their mission to assimilate devices like Crypto Atm to local society .


XMRUSD BEARISH Pattern on H4 + DailySHORTING @ 51 - 52
Target 1 seems quite probably for around +3% profit

XMRUSD formed bullish Shark | Upto 29% bullish movePriceline of Monero / US Dollar cryptocurrency has formed bullish Shark pattern and entered the potential reversal zone.
This PRZ area should be used as stop loss point in case of complete candle stick closes below this zone.
I have used Fibonacci sequence to set the targets:
Buy between: 52.949 to 49.193
Sell between: 56.295 to 63.804
Regards,
Atif Akbar (moon333)


XMRUSD: Trend Reversal SignalThe price bounced from 45.00 support level. RSI confirms the price reversal. MACD histogram supports a possible upward movement.
We have a trend reversal signal based on a bullish divergence. It is possible to buy based on this signal, but it will be better to wait for a breakout above the main downtrend line. If the price can move above the trend line and SMA100, it will give us another bullish signal. This trade will be good if you want to catch a new uptrend movement.

Get out of XMRImminent 'monthly' 20/50 MA-Cross, consistent lower highs for 2 years straight. Exit your long position or balance your trade. Strong-Sell (short) initiated for XMR to 27 with lows of sub 24 within 3 months. Possible quick rebound from there but general down-trend to continue long-term.

XMR/USD LONGXMR/USD
XMR is another pair with USD facing a falling wedge form. XMR recently hit the bottom of the wedge and bounced with a strong green wick in a bullish direction. This was also the touch of the top of a strong support zone. I expect the bounce to continue here to rock outside the wedge and hit T1 at $51. The stoch has already crossed bullish and RSI has bounce off oversold. Right now, everything is pointing upward and I expect the rise to continue. Look for a touch of the 50 MA at T2 at $55, then on to the final target above the 100 MA at 60. Expect a top close to here as we reach the previous bounce high, recommended to take profit following the according profit lines.
Possible Entries: $47.00-47.40

Monero super cycle!we are about to form the C wave of the bigger correction, which is the 5th on the inferior bear impulse, the 5th will make an oscillator divergence with the previous low (3rd). then we will be on the end of a super cycle II wave and launch to a huge long III and V wave !! be ready for the ride !


