XMRUSDT.P trade ideas

XMR/USDT 4H SHORT BINGXHello, traders! I present you with an interesting short trade opportunity for the asset. Through a detailed technical analysis, I have identified a series of bearish signals that suggest a potential downward movement in the short term.
💡IDEA DE TRADE BingX💡
XMR/USDT 4H Alto Riesgo Según mi análisis;
Entrando por debajo del 0.66 ( No es un numero Fibo )
Stop Loss de 1.78%, primer objetivo 134.01 segundo objetivo siendo muy optimistas al maximo bajo anterior, al tener aún fuerza bajista en gráfico diario este impulso por mucho llegaría al 0,666 que también concuerda con la media de 55 en 4H y la media de 20 en 12H y esto para seguir callendo

XMRUSDTXMRUSDT is under strong sell pressure and continuously printing LL and LH. After recent sell off currently the market is making LH, will it print new LL?

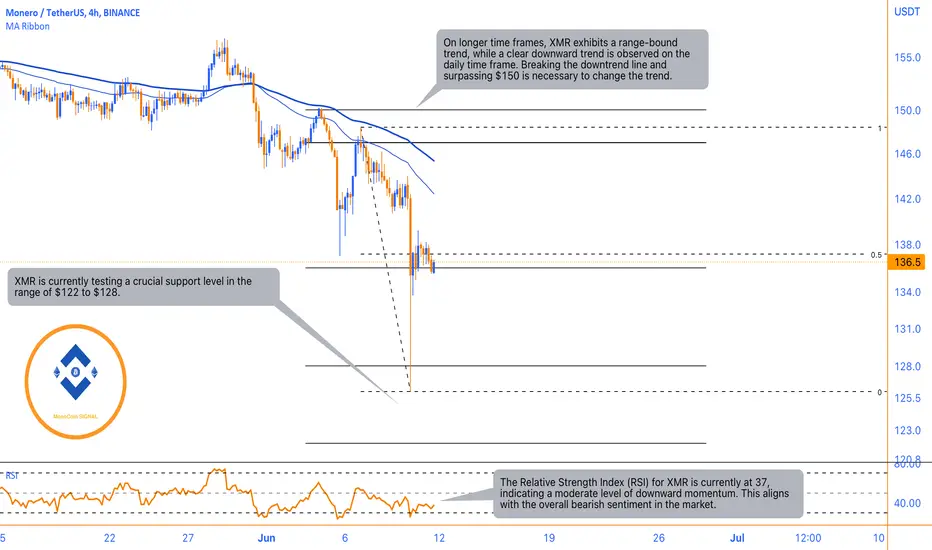
Downward Trend and Key Support LevelsOver the past month, XMR has been trending downwards, experiencing a moderate level of selling pressure. This led to the breach of its initial support level around $147, and the price subsequently hit the second support level at approximately $136. As anticipated, there was a positive reaction at the second support level, resulting in a 6% increase in XMR's price. However, the buying power was not sufficient to break through the resistance at the $147 range, indicating a pullback in the ongoing downward trend.
The RSI level for XMR is currently at 37, indicating a moderate level of downward momentum. This suggests that there is still some selling pressure on XMR, but it is not yet in an oversold condition. The RSI level of 37 aligns with the overall analysis, confirming the presence of bearish sentiment in the market.
As the selling pressure persists, XMR lost support at the $136 range and is now testing an important support level situated between $122 and $128. This support level corresponds to the starting range of the last upward movement observed on a weekly basis. It is crucial for XMR to hold above this support range to avoid further downward movement.
Taking a broader perspective, on longer time frames, XMR is currently in a range-bound trend, while on a daily time frame, a clear downward trend is evident. To change the trend and reverse the downward movement, XMR would need to break the downtrend line and rise above the resistance level of $150.
Considering the combined analysis of the price action, support and resistance levels, and the RSI, it suggests that the market sentiment for XMR remains bearish, with selling pressure continuing to influence the cryptocurrency's price. Traders and investors should closely monitor the support level around $122 to $128, as a significant break below that range could potentially lead to further downside movement for XMR.
XMR Potential Ban of anonymous crypto projects !If you haven`t sold XMR here:
Then i will remind you that Monero (XMR) has gained popularity for its capacity to enhance user anonymity, making transactions challenging to trace through the utilization of stealth addresses. However, this aligns with a goal that regulators do not necessarily support in the cryptocurrency space.
A leaked version of a US draft bill has surfaced, suggesting the elimination of anonymous crypto projects. The proposal also mandates that DAOs, DeFi platforms, and exchanges register legally in the United States. This development indicates a potential shift towards greater regulation and oversight within the industry.
My price target for XMR is $96.50.
Looking forward to read your opinion about it!

‼️ Trade Idea‼️. ‼️ Trade Idea‼️‼️ Trade Idea‼️
XMR/USTD entering exactly 0.618 (shown on price scale) with SL below previous low (shown on price scale) first target 0.5 to protect entry price, second target until looking at reversal patterns
‼️‼️THIS IS JUST A TRADE IDEA BASED ON MY OWN ANALYSIS, IF YOU DECIDE TO TAKE IT IT IS YOUR TOTAL RESPONSIBILITY TO FOLLOW UP AND MANAGE YOUR PORTFOLIO‼️

Monero (XMRUSDT) an 80% rise I won't be talking too much about how bullish XMR is currently. But we just went along quite aggressively considering multiple technical aspects of the current price action. The most important is obviously the weekly break and close above the long-term downtrend trendline. Secondly, we have the price hoovering above the 61.8% Fibonacci level for quite some time now. It is either to go big now or....
We are going in now!

Monero's $130 Threshold: The Make-or-Break for an 80% Upswing💎 Since #XMRUSDT's bounce and rejection of the 78.6% Fibonacci support, coupled with the uptrend trendline, we're seeing the price gravitate towards that trendline once more. This suggests that buying pressure could be ramping up, opening the door to a significant upside potential.
💎 However, this bullish scenario will hold water only if the $130 psychological and technical support level remains unbreached. If this condition is met, we could be looking at a nearly 80% price increase, with #Monero potentially setting its sights on the double Fibonacci resistance at $258.
💎 Our ParadiseClub members should also keep an eye on the nearest resistance at $196, where the 23.6% Fibs intersects with the downtrend trendline.
💎 While less likely, we must also consider the scenario where OMXSTO:XMR breaks below the $130 level. Such a move would be a major red flag for the bulls.

XMRUSDTRisk warning, disclaimer: the above is a personal market judgment based on published information and historical chart data on Tradingview, all analysis is only subjective. Hope investors consider, that I am not responsible for your investment decision.
Thank you.
Good luck

XMRUSD ❕ upper limit of the channelTrading volumes are expressing interest in price growth.
The RSI chart is moving in the bullish zone on the 4H Timeframe.
Price has fixed above the 200EMA on the 4H Timeframe.
I believe that the asset will continue to grow after fixing above the channel.

✴️ Monero Long-Term Recovery, Leads To Long-Term GrowthThe bear market bottom was set June 2022 for Monero, XMRUSDT.
After this low was hit, we are seeing a long-term recovery phase.
We have a strong resistance level around 180.
Each time this level is hit it becomes weaker.
Monero is on the move again based on this 3D chart.
The last two candles closed bullish and the current one is pushing prices above EMA10.
This pair is set to challenge 180 again... As soon as 180 breaks, we should see a strong jump take place.
Then more consolidation before the next bull-market cycle.
Patience is key.
Monero is good for the long-term.
Namaste.

XMRUSDT- pushing the level to 150Hello everyone. Today we will analyze XMRUSDT in general terms. This coin has recently had very low volatility, as the price is squeezed by levels from above and below. Therefore, we should expect some kind of movement in the near future. And judging by the fact that we have been knocking on the 150 level for the umpteenth time, there is every chance to finally break through it and reach 138. We will put a stop behind the trend line at 153.9.

Corrective CycleIn recent weeks, XMR has demonstrated a persistent trend confined within a defined range. Significantly, it has breached its upward trend line, indicating a shift towards a corrective cycle on the daily time frame. Presently, XMR is trading within the $153 range. Notably, transaction volume has experienced a notable decline, falling below the 30-day average.
Monero's price movement is influenced by two support levels, with particular emphasis on the second support range. The first support stands at $147, while the second support lies within the range of $135.7 to $138.8. Sustaining the second support range presents an opportunity for potential price growth, potentially reaching the upper bounds of the weekly channel range around $186.
Considering the broader long-term range trend of the Monero currency, favorable market conditions can be anticipated to facilitate substantial growth.

XMR ready to go downThe instrument has formed a clear local support level, tested with a few touches, beyond which I expect to see unrealized liquidity. Short impulses and a decrease in price highs are also noticeable, which indicates the strength of sellers.

XMRUSD ❕ downtrend channelMonero has consolidated under 200EMA on 4H Timeframe.
The RSI chart is moving in the bearish zone on 4H, 1H and 30m Timeframes.
50EMA has broken down 200EMA (1H TF)
TD Sequential indicator has formed a reversal signal down (1H TF)
I believe that the asset will continue to decline after fixing under the support level.


Xmr Looks Promising Here Xmrusdt
Love the way xmr ignoring btc movement
Attempting breakout incase of successful breakout I am expecting 80-100% bullish wave

Monero (XMR) Targeting 193Over the past 12 months, Monero’s price has been relatively stagnant (current price is practically the same as 1 year ago), leading to a challenging analysis due to the prolonged sideways correction. As such, we must work with probabilities to better understand its potential movements.
First Probability:
Pullbacks usually reach a 50% retracement. Monero’s gradual rise has not yet reached the 50% level, leaving room for further growth. The 50% retracement level is a commonly observed technical level is observed by market participants. Monero’s case, the fact that the price has not yet reached this critical level suggests that there might still be some bullish sentiment and further upside potential.
Second Probability:
Correction swings or waves typically extend at least 100%. XMR has also fallen short of this mark, and the pivot of black wave B hasn’t been breached. The 100% extension is another key technical level that has over 70% incidence. In Monero’s context, the fact that the price has not yet reached this level may indicate that the correction is incomplete and that we may see a continuation of the current trend. Note that the 100% extension matches almost perfectly with the 50% pullback level, which is an interesting confluence factor.
Third Probability
Price has tested and rejected a confluence of trendlines as support, indicating a possible upward movement as a follow-through. Trendlines are essential tools for traders to understand the overall direction of the market. In Monero’s case, the rejection of the confluence of trendlines as support signifies that the market participants are still confident in the coin’s potential to rise in value. This sentiment, combined with the other technical factors, increases the likelihood of an upward price movement.
XMR Monero Price Prediction
Taking these three factors into account, I have a bias towards XMR continuing its upward trajectory, potentially reaching at least $193 (a 50% pullback to the upside). While my expectation is for the $132.3 level to hold, this scenario only becomes invalidated below $115.3.

Xmr Building Up for Massive Breakout Seems Like Getting ready for Massive Breakout formed Descending Channel In 3 days Timeframe Incase Of Breakout Expecting 180 to 200% bullish Wave

XMR wedgeXMR is currently trading in a wedge. for short term moves look for potential rejection or breakout and holding above the POC

XMRUSDT wants the dynamic support? XMRUSDT is testing a crucial support level, which could determine its future trajectory.
If the support level is breached, according to Plancton's Rules, it may signal a new short position. Therefore, it is important to closely monitor the price action and volume in the coming hours and days to assess whether the support level will hold or break.
–––––
Follow the Shrimp 🦐
Keep in mind.
🟣 Purple structure -> Monthly structure.
🔴 Red structure -> Weekly structure.
🔵 Blue structure -> Daily structure.
🟡 Yellow structure -> 4h structure.
⚫️ Black structure -> <= 1h structure.
Follow the Shrimp 🦐

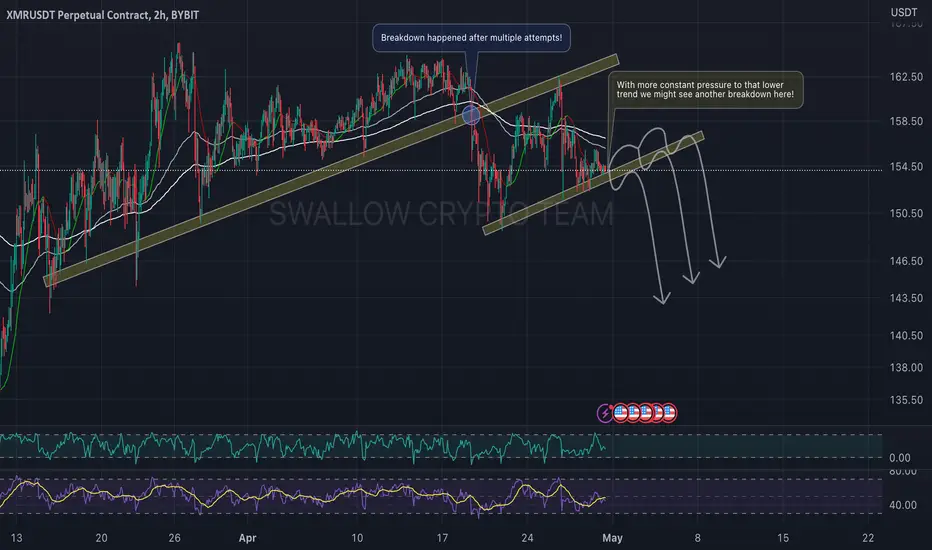
XMR/USDT looking for similarities! Hey guys 👋
XMR/USDT has been testing that trend for a while now. With that being said we see a good chance for another breakdown to happen here which should look similar to the last one. Keep an on this one 😉
If you like ideas provided by our team you can show us your support by liking and commenting.
Yours Sincerely,
Swallow Team
Disclamer:
We are not financial advisors. The content that we share on this website are for educational purposes and are our own personal opinions.
W10-2 XMR BULLISH IDEA (DOUBLE BOTTOM)
The price has pulled back from the double bottom, and it is expected that it will break out the neckline at 156.05.
The double bottom pattern and bullish divergence are formed simultaneously.
potential bullish entry at the breakout of the neckline at 156.05SL and TP levels are defined.
