XMRUSD: Continuation and Potential Exttension of Bullish TargetA couple weeks ago XMR showed potential to continue a Bullish ABCD BAMM as seen in the related idea below and so far things have gone well and is about halfway to hitting the target; but in doing so it's also breaking out and confirming above a more macro structure and confirming the validity of a Bullish Butterfly. If this Continues we could see targets much higher than the original ABCD BAMM and perhaps see upto a 61.8%-88.6% Retrace to the upside as a result of breaking above this Wedge and Channel.
XMRUSDT.P trade ideas

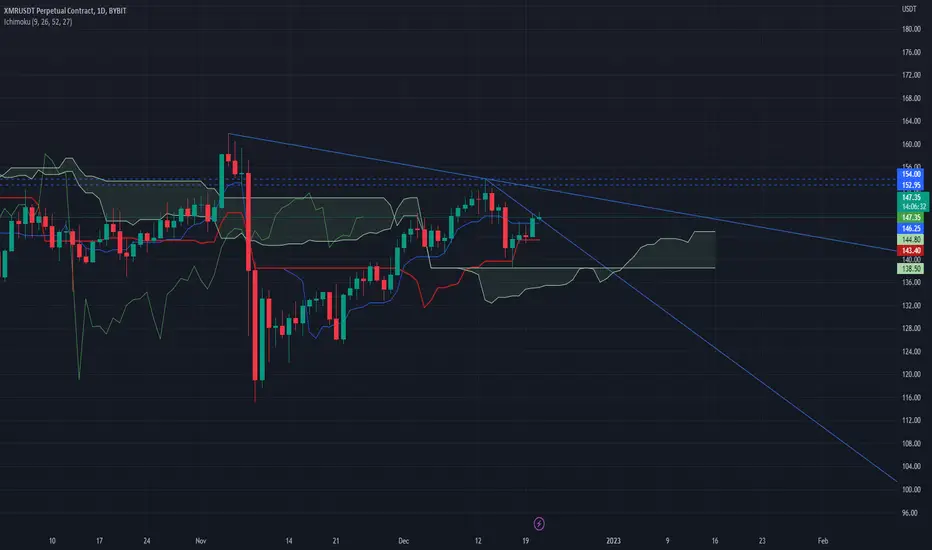
XMR ready to pop stay above 120.50 target 205.00 Great DCA areasNot financial advice.
Chart pretty self explanatory.
We stay above the trendline of 120.50 we can have a target in mind of 205.00 and beyond.
RSI looks great on weekly.
Fisher looks good.
3 day itching for a breakout.
Took liquidity at 127.00 to knock out low of flash crash from all time high
Remember DYOR
#PIK
Patience is Key
#TLAW
Think Like A Whale
Like and follow

XMRUSD ❕ trading between zonesMonero trades between a resistance zone and a support zone, under liquidity.
On the 1H Timeframe, 50EMA and 200EMA form a "cross of death" pattern.
I expect a fall if the price fixes below the support level. Further movement will depend on price reaction to the support zone.

XMR Missing Corrective waveWe still lack one more leg down before fufilling larger scale wxy on Elliott wave. Good entry for short here. On the smaller fractal of WXY we're just missing that X leg.

XMR ScalpAppears to be in a three drive pattern on a short term trade. If you like to scalp then you could probably consider this one. Show me some love if I make you some money

Rising wedge and Head and shoulders pattern in MONEROPossibility of approving the head and shoulder pattern for XMRUSDT

XMR: Channel DownMonero (XMR) technical analysis:
Trade setup : Price is trading in a Channel Down pattern. It rebounded from Support zone ($125-130) and reached stiff resistance area near $150. This is a critical level. Price is likely to get rejected here, but if it’s able to break through, it could revisit $175 thereafter.
Pattern : Price is trading in a Channel Down pattern. With emerging patterns, traders who believe the price is likely to remain within its channel can initiate trades when the price fluctuates within its channel trendlines. With complete patterns (i.e. a breakout) – initiate a trade when the price breaks through the channel’s trendlines, either on the upper or lower side. When this happens, the price can move rapidly in the direction of that breakout.
Trend : Uptrend on Short- and Medium-Term basis and Neutral on Long-Term basis.
Momentum is Mixed as MACD Line is below MACD Signal Line (Bearish) but RSI ~ 50 (Neutral).
Support and Resistance : Nearest Support Zone is $125-130, then $100. The nearest Resistance Zone is $150, then $175, and $200.

XMRUSD: ABCD Bullish BAMM ContinuationWe have Hidden Bullish Divergence at the neckline of what appears to be a Bearish Head and Shoulders, XMR has been quite Bullish though and is still in the process of completing a Bullish BAMM so this may be a nice time to counter the Head and Shoulders Pattern and go for the 1.272 ABCD Completion.

XMR/USDT. It's going to breakdown the channel, we just wait for comeback for rest, when resetting will be confirmed then open short position at $142,4.

XMR/USDT Possible head and shoulders formation BINGX:XMRUSDT
XMR/USDT is one of the dinosaurs of the crypto world, the asset in my reading is set to build a head and shoulders formation.
The operational risk of this trade is low compared to the potential, I believe that in the break-even zone, confluent with the neckline of the OCO I will consider taking my risk out of the operation.
The Asset has broken out of an uptrend channel, which should lead either to a laterality or to a reversal context, if it is a reversal it is aimed at a correction in Fibonacci zones or even at the beginning of the uptrend channel.
That's my perspective for the future price shift.
So the targets in my reading for the asset will be; 139 / 128 / 120 / 105.5
🔴Disclaimer: The comments above reflect solely and exclusively my opinion, this is not a recommendation to buy or sell. Just a series of published studies, so that with the community we can discuss tactics and operational techniques.
🔹 Would you like to ask any questions, take that doubt? Feel free, I'll be happy to help.

XMRUSDT | BullishTrend| 1 Hr
XMRUSDT is making a cup and handle pattern. Also it is in bullish trend.
It seems it will continue its bullish trend.

Monero XMR prediction for the end of the yearThis week we have the CPI report and the FED meeting. I expect the stock market to go down and cypto to fallow it.
My price target for Monero XMR for the end of the year are the following:
XMR/USDT short
Entry Range: $148 - 155
Price Target 1: $140
Price Target 2: $134
Price Target 3: $125
Stop Loss: $169

XMR Idea: The price forms a bearish head and shoulders pattern. The price will rebound from the specified trend line and start a local downtrend

Xmr usdt can Monero the privacy coin holdThis will be interesting to watch monero is currently holding at support but its not its last can it hold its place of will it go to the next level tell me your views thanks for looking trade safe guys.

XMRUSDT 1HXMR, formed a didactic bullish channel with rising bottoms and rising tops. passing through the Upper band which is at 147.1, it will only stop at 148.1. The VWAP coinciding with the MM100 means that the 145.5 zone is a big support.
Here are the supports and resistances:
S: 145.5 / 144.2 / 143.0
A: 147.1 / 148.2 / 149

XMR: Channel DownMonero (XMR) technical analysis:
Trade setup : Price is trading in a Channel Down pattern. It rebounded from Support zone ($125-130) and reached stiff resistance area near $150. This is a critical level. Price is likely to get rejected here, but if it’s able to break through, it could revisit $175 thereafter.
Pattern : Price is trading in a Channel Down pattern. With emerging patterns, traders who believe the price is likely to remain within its channel can initiate trades when the price fluctuates within its channel trendlines. With complete patterns (i.e. a breakout) – initiate a trade when the price breaks through the channel’s trendlines, either on the upper or lower side. When this happens, the price can move rapidly in the direction of that breakout.
Trend : Neutral on Short-Term basis, Uptrend on Medium-Term basis and Downtrend on Long-Term basis.
Momentum is Mixed as MACD Line is below MACD Signal Line (Bearish) but RSI ~ 50 (Neutral).
Support and Resistance : Nearest Support Zone is $125-130, then $100. The nearest Resistance Zone is $150, then $175, and $200.

XMRUSDT 1HNotice how beautiful the high channel formed by XMR is! At the moment XMR is surfing the median of the Keltner channel towards the upper channel line (at 146.2) which is strong resistance. Breaking this resistance it will face the MM200 at 147.4 to meet the upper base of the bullish channel at 148.4.
XMR is one of the most decentralized privacy coins.
Here are the supports and resistances:
S: 144.5 / 143.2 / 141.5
R:146.1 / 147.4 / 148.4


XMRUSDT - Long by Supertrend, ADX & MA 17/12/20221. ADX INDICATOR: 1h & 4h timeframe have a strong strength for open trade.
- ADX smoothing: 14.
- DI length: 14.
- ADX STRONG > 25.
2. SUPERTREND INDICATOR:
- Short trend when closes candle is below the red line.
3. MOVING AVERAGE INDICATOR:50
- Short trend when closes candle is below MA line.
4. - SELL/SHORT: reject to Supertrend at current timeframe.

XMR: Channel DownMonero (XMR) technical analysis:
Trade setup : Price is trading in a Channel Down pattern. It rebounded from Support zone ($125-130) and reached stiff resistance area near $150. This is a critical level. Price is likely to get rejected here, but if it’s able to break through, it could revisit $175 thereafter.
Pattern : Price is trading in a Channel Down pattern. With emerging patterns, traders who believe the price is likely to remain within its channel can initiate trades when the price fluctuates within its channel trendlines. With complete patterns (i.e. a breakout) – initiate a trade when the price breaks through the channel’s trendlines, either on the upper or lower side. When this happens, the price can move rapidly in the direction of that breakout.
Trend : Uptrend on Short- and Medium-Term basis and Downtrend on Long-Term basis.
Momentum is Bullish but inflecting. MACD Line is above MACD Signal Line and RSI is above 55 but momentum may have peaked since MACD Histogram bars are declining, which suggests that momentum is weakening.
Support and Resistance : Nearest Support Zone is $125-130, then $100. The nearest Resistance Zone is $150, then $175, and $200.

