XMR/USDTXMR/USDT
It is in a descending channel.
It is involved in the support of 125 dollars.
This support has weakened enough that it is too likely to be lost
Targets are available.
#XMRUSDT #XMR #BTCUSDT #BTC #ETHUSDT #DOGE #DOGEUSDT
XMRUSDT.P trade ideas


XMRUSDT SHORTShort, wait for back test of gloden pocket, available up to 0.886 PRZ otherwise too late to short it.
SL breaking PRZ.
With such of negative situation of BTC we may see far target of profit.
Hidden negative divergent. Bear sign

XMR/USDT - SHORT BEAR----- Welcome, dear followers! -----
- Here is my trading methodology. I trade with a normal system and analysis of resistance and support, as well as price reversal patterns.
- For the record, I do not place a stop loss within my trades. So that I only risk 1.5% of my total capital in order to support the loss due to a price reversal against me.
- If a price reversed against my expectation and touched the drawn line r3, then I transferred targets to the entry point and waited for the price to close at it with a loss equal to almost zero.
- Today's deal is shown in the chart, and here are the entry and exit points below.
-- Support me with numbers and follow up on my account for other deals in the future. Thank you for coming to this part. --
-------------------------------------------------------
⚡️⚡️ XMR/USDT ⚡️⚡️
Exchange: Binance Futures
Trade Type: Breakout (Short)
Leverage: Cross (1.0X)
Entry Orders:
1) 134.62 - 100.0% (48.94603 USDT)
Take-Profit Orders:
1) 123.62 - 80.0%
2) 112.21 - 19.999%
Trailing Configuration:
Stop: Breakeven -
Trigger: Target (1)

XMR/USDT - SHORT NOW NOWhello back guys!
we back again with new ideas
here XMR/USDT I thing we will go short cuz we break CHANNEL down
we have
tp1 IS 1.61% FIBO Retracement
tp2 as targets
and stop lose is mental in 1R
I don't Use stop lose if price go and touché 3R line I will move Tps In entry price and with from price come back and close with 0 lose
if price go more than 6 month and don't come back to entry price I will close it with lose.
good luck guys

XMR ABOUT TO BOOM BOOM!!We should expect heavy pump after the resistance block is successfully broken.
Entry is before the resistance.


Strong Support for XMRThe chart shows strenght at this price range and I expect a bounce from the supportline. Possible new ATHs soon!

XMR Delisting on Huobi will negatively impact anonymous coins. It is possible that delistings will continue on other major exchanges. The price failed to break the trend line. Many bearish divergences are forming. Perhaps we will see a trend reversal soon.

XMR: TIME UPDATEXMR shows for day trade structure volume what could get XMR to high price actions.
We will see how this will play out for the daytime frame.
This is not trading advice.

XMR long from 126XMR has tested support three times now so I would expect it to break down on the next test, I will be looking to limit long at 126 hopefully execute this week

XMR Spot Idea (Long term) 💡Hello, TradingView community and my subscribers, please if you like ideas do not forget to support them with your likes and comment, thank you so much and we will start.
Today I want to share my opinion with you about XMR

XrmusdtShort
E1 150
E2 147.8
Tp free
Up: 151
Down 128
Amount: min
Order difference : 0.25%
Order sell: 0.5%
Tp : 1% wallet save profit
Save 1% profit every time and keep a small amount until the last target
Open only with bot can

XMR The possibility of descentTowards further decline
Log in after breaking the area and after confirmation
from aron broker
Personal possibilities :)))))


XMRUSDT | IMPORTANT ZONEXMRUSDT has been trading near the horizontal resistance zone. The price has continuously taking support from rising supporting trendline.
The price action at this zone must to be watched out for confirmation of trend.
The bulls need to break above the horizontal resistance. While bears will be active below the break of rising support.

#Monero Flatlining and Bearish, will Bulls hold above $140?Past Performance of Monero
XMR is stable in the past 24 hours and week of trading. The Monero candlestick arrangement in the daily chart points to fizzling downside momentum and resilience of buyers, a net positive for bulls. Nonetheless, despite the horizontal movement of prices since August 19, the coin is within a bear breakout formation, and the probability of prices swinging back to bearish remains high.
#Monero Technical Analysis
From the daily chart, Monero prices are stable and buyers firm. However, prices are within the August 19 bear candlestick, reaffirming the presence of sellers from an effort versus result perspective. Therefore, in the immediate term, and since prices are in range mode within a $20 zone with caps at $140 and $160, traders may search for liquidating opportunities below August 19 highs at $160. On a safer approach, traders can wait for a clean break below $140 to trade with the trend in affirming losses of August 19 with targets at $125, the 61.8 percent Fibonacci retracement level of the June to August 2022 trade range. Any expansion above $160 with rising participation levels will cancel this bearish preview, allowing another alignment in price action towards $200.
What to Expect from #XMR?
Monero is down roughly 10 percent from August 2022 highs and within a $20 range. Bears remain in charge, and any dip below $140 will confirm losses of August 19 in a bear breakout formation.
Resistance level to watch out for: $160
Support level to watch out for: $140
Disclaimer: Opinions expressed are not investment advice. Do your research.

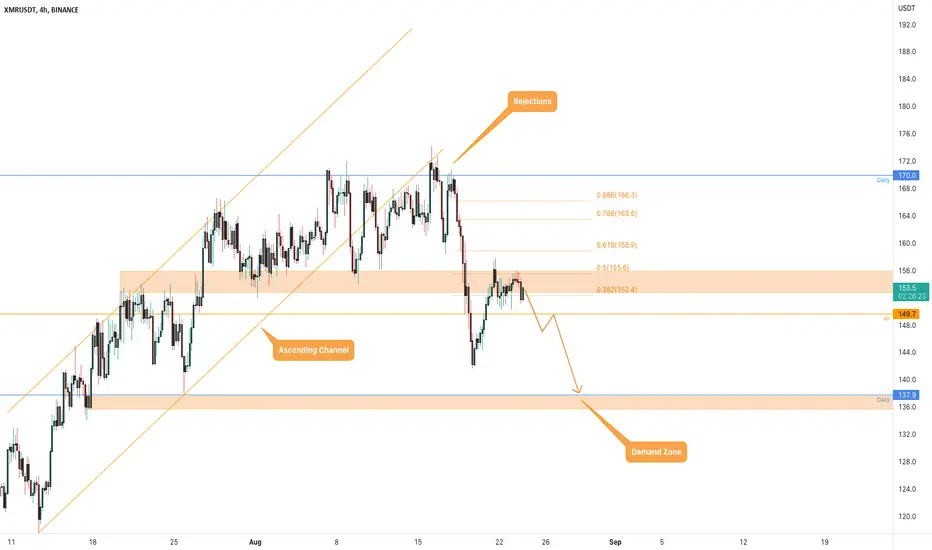
XMRUSDT is testing the key levelThe price is testing the 4h resistance after the rejections form the daily resistance inside an ascending channel on 170$ area.
Now the price had a bounce and the market is testing the 0.5 Fibonacci level.
How to approach it?
IF the price is going to have a breakout from the 4h support and retest it as new resistance, According to Plancton's strategy , we can set a nice order
–––––
Keep in mind.
🟣 Purple structure -> Monthly structure.
🔴 Red structure -> Weekly structure.
🔵 Blue structure -> Daily structure.
🟡 Yellow structure -> 4h structure.
–––––
Follow the Shrimp 🦐
Monero XMR/USDTXMR, have a good potential for touch again 90-100 usdt, after 155 short corection is almost finished for all way till 100

XMRUSDTXMR/USDT
It is in a descending channel.
On the other hand, it has lost its dynamic support line.
I expect it to fall to the specified levels.
#XMRUSDT #XMR #BTCUSDT #BTC #ETHUSDT #DOGE #DOGEUSDT

XMRUSDT 3D How much can Monero anonymity cost?Today, on the global chart, we will consider the XMRUSDT price movement
Monero is an old crypto coin. It is popular because it is "the last of the Mohicans", which preserves the anonymity of the owner.
Quite often moves on an individual route despite the trajectory of the BTCUSDT price.
During the fall of the crypto market in June 2022, the XMRUSD price was held by a powerful mirror level in the area of $96.
XMR price is currently trying to establish itself at the top half of the descending trend channel that has been stretching since May 2021
If the price is firmly anchored at the top half of the channel, as well as a little positive in the crypto market, everything is set for continued growth.
We expect that with such a schedule, the XMRUSDT price may rise to $330 at this year.
_______________________________
Since 2016 , we have been analyzing and trading the cryptocurrency market.
We transform our knowledge, trading moods and experience into ideas. Each "like under the idea" boosts the level of our happiness by 0.05%. If we help you to be calmer and richer — help us to be happier :)

