XMR/USDTIn this market situations, it is a huge risk to making trades. However, if you are one of the risk lovers there is a trade option. Do not trade before 4h close above the enter price.
XMRUSDT.P trade ideas

XMR/USDTxmr / usdt
Hello dear ones.
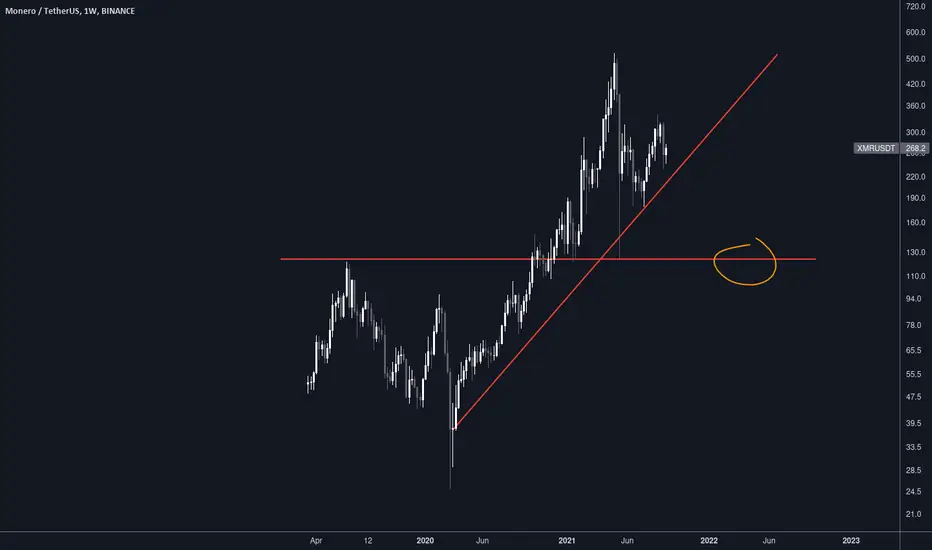
It is located in a descending channel as shown in the chart.
What is obvious is that it has reacted to the bottom of the canal and increased its price up to the middle of the canal.
This point is the midline point of separation and the resistance above it. We are expected to have a small $ 125 range again.
If there is a bearish market in that range ($ 125), the $ 57 range is available, but if the market grows, it can rise to the $ 270 range.
#XMR #BTC #ETH #LUNA #USDT #ADA

XMRUSDT wants the necklineThe price is testing the supply zone on 178$ where the market created an important daily resistance on the 0.5 Fibonacci level.
On the 4h Timeframe the price created the W pattern and we can find the neckline on 150$.
How approach it?
If the price is going to lose the support on 160$, According to Plancton's strategy , we can set a nice order
–––––
Keep in mind.
🟣 Purple structure -> Monthly structure.
🔴 Red structure -> Weekly structure.
🔵 Blue structure -> Daily structure.
🟡 Yellow structure -> 4h structure.
–––––
Follow the Shrimp 🦐

XMRUSDT decision zone hi guys
if we brake the resistance and close 4h candle above we are bullish
and if not we have to wait

XMRUSDTHello everyone, it is a downtrend and the price has hit the trend line and is back, here I took a short position. In the last few days, the price has reached my target twice and it is coming again. Be successful and professional.


XMRUSDT TREND LINE ANALYSISNice to meet you, everyone
I'm an alt trader
I'm analyzing and recommending things that are similar to my personality among many alt coins
----------------------------------------------------------------------------------------------------------------------
It retest after breaking the upward trend.
If the retest is successful, it will go down.

XMRUSDT UPDATEXMR playing out as projected in my previous analysis - i hope some of you managed to capitalise on my previous update.

XMRUSDT UPDATEXMR like the majority of the crypto market has now made a correction since the recent bearish impulse. Currently the market has retraced to the 0.50 fib and is forming a bullish wedge underneath a very strong confluence of supply, which indicates to us that this consolidation is a bullish induction pattern. We will be waiting for the market to sweep the highs trap bulls before we look for short entries


short XMRUSDT
Convenient location for sale
In the price of 168 to 170
4-hour candle loss limit close to 200
Target price 120 to 110
Price drop at 16:30 May 16 Iranian time

XMR - Where Are You Bulls?Hello TradingView Family / Fellow Traders. This is Richard, as known as theSignalyst.
WEEKLY: Left Chart
XMR is overall bearish however it is currently sitting around a strong support zone (120.0) so we will be "looking" for buy setups on lower timeframes.
H4: Right Chart
XMR is forming a channel in red but the upper trendline is not valid yet, so we are waiting for a new swing high to form around it to consider it our trigger swing. (projection in purple)
Trigger => Waiting for that swing to form "and then" buy after a momentum candle close above it (gray zone)
Meanwhile, until the buy is activated, XMR can still trade lower inside the support zone or even break it downward to test the lower support (50.0)
Always follow your trading plan regarding entry, risk management, and trade management.
Good luck!
All Strategies Are Good; If Managed Properly!
~Rich

XMRUSDT needs to hold the dynamic support!
the price tested again the 0.786 Fibonacci level on the monthly timeframe and have a breakout from the descending channel on the weekly timeframe.
As you can see the price has a confluence on 227$.
On the 4h timeframe the price created a descending channel had a breakout but without momentum.
So How we can approach it?
If the price is going to loose the support, According to Plancton's strategy , we can set a nice order
–––––
Keep in mind.
🟣 Purple structure -> Monthly structure.
🔴 Red structure -> Weekly structure.
🔵 Blue structure -> Daily structure.
🟡 Yellow structure -> 4h structure.
–––––
Follow the Shrimp 🦐

XMRXMR is a decentralized cryptocurrency. It uses a public distributed ledger with privacy-enhancing technologies that obfuscate transactions to achieve anonymity and fungibility. Observers cannot decipher addresses trading monero, transaction amounts, address balances, or transaction histories.
ABC down after 5 wave impulse.
Monero - Are the Bears going to win this⁉️💎The long-term trend for Monero is bullish as long as we hold the highlighted support zone. But are bulls strong enough to defend it?
💎Today XMR/USDT is back at the major monthly support zone after a heavy selloff this week. The selling pressure is rising once again with a big volume which suggests that bears are trying to push XMR below the demand zone.
💎Right now, the risk/reward buying opportunity is very good, but the probability of holding this uptrend to higher targets of 20-50%+ remains low. For a professional trade setup, there must be a combination of a good RR and a high probability of a trend, and we are waiting for such a confirmation before we take an action.
💎Soon we will find out if support is respected and MACD forms a bullish divergence or breaks lower. We are getting ready for a huge ...

XMR - dead cat bounce ?Monero loosing momentum and getting into a H4 downtrend + 232 level flipping resistance
Invalidation is large as volatility could be high next week : reduce half position at 245 // close at 260
TP on next horizontal levels : 179 & 138
Cheers


No such things as a privacy coin lol this ones gonna pull a LunaStrong sell this Target is $1.50. Not financial advice
This chart looks like its gonna go negative... You will end up owing money for holding this shenanigans coin. Think you can hide from the government lol. Citadel aka the Government hit squad gonna make an example out of this,

XMRUSDTHello Crypto Lovers,
Mars Signals team wishes you high profits.
This is a one-day-time frame analysis for XMRUSDT
Clearly, the price is fluctuating on the long-term support line and if it moves over this line and fluctuates there, then it will have a proper rise upward to the resistance line. But in case it moves below the support line, it faces more fall.
Warning: This is just a suggestion and we do not guarantee profits. We advise you analyze the chart before opening any position.
Wish you luck

XMR Monero LongXMRUSDT had consolidation on H1 TF, After that price had breakdown to liquidate buyers. buyers are already dead now it's time for a little uptrend to kill shorters from previous consolidation. Approximately it is $250-255.

Open Short Position on XMRUSDT!I dont know why I lost the XMRUSDT and didn't continue to track it. Did you remember my Idea on this coin? I should follow it after cross over out the Chanel!!
I opened the Short position just few Minutes ago in order to study more about its price movement.

Monero | The Market Loves MoneroMonero | The Market Loves Monero
The price is moving within this triangle pattern since Bitcoin began the bearish movement.
As you can see Monero looks like it is a favorite pattern as long as the price is making up and
downs by 10% to 12% within the triangle pattern.
The market doesn't want to let it move lower.
However, considering that the pattern can break out on both sides we have to consider both scenarios.
Thank you and Good Luck!

