XMR: Approaching ResistanceMonero (XMR) technical analysis:
Trade setup : Price is in an Uptrend overall. But near-term, after getting rejected at $170 two- or three times, that could signal a Double or Triple Top pattern, which is negative (bearish). Now we wait for price to either 1) break above $170 to signal uptrend continuation, or 2) pullback to $150 level that could serve as an attractive entry opportunity.
Trend : Neutral on Short-Term basis and Uptrend on Medium- and Long-Term basis.
Momentum is Mixed as MACD Line is below MACD Signal Line (Bearish) but RSI ~ 50 (Neutral).
Support and Resistance : Nearest Support Zone is $163, which it broke, then $150. The nearest Resistance Zone is $170, then $187.
XMRUSDT.P trade ideas

XMR - Trading plan hasn't changedAfter a false breakout to the downside, price action regained the trend from my previous post (see related idea).
I am waiting for a pullback to enter long trades, targeting initially 50% pullback to the upside at 193.

XmrThe upper red lines are a strong resistance zone that can cause the price to decrease. Currently, I am looking at the green lines for buying and selling Sculpi or in the medium term.

XMRUSDT Daily Chart Forming Bull Flag But ?
RSI Showing Did Over Bought Area
I Am Watching to break down top line with full body candle
Education propose Only
Please Do Your Own Research

XMR presents a bearish structure on the daily and H4 chartsXMR presents a bearish structure on the daily and H4 charts. It's time to get in on this opportunity

TRADE OF THE DAY | XMR Potential 4.1%TRADE OF THE DAY | XMR Potential 4.1%
| Targets On Chart
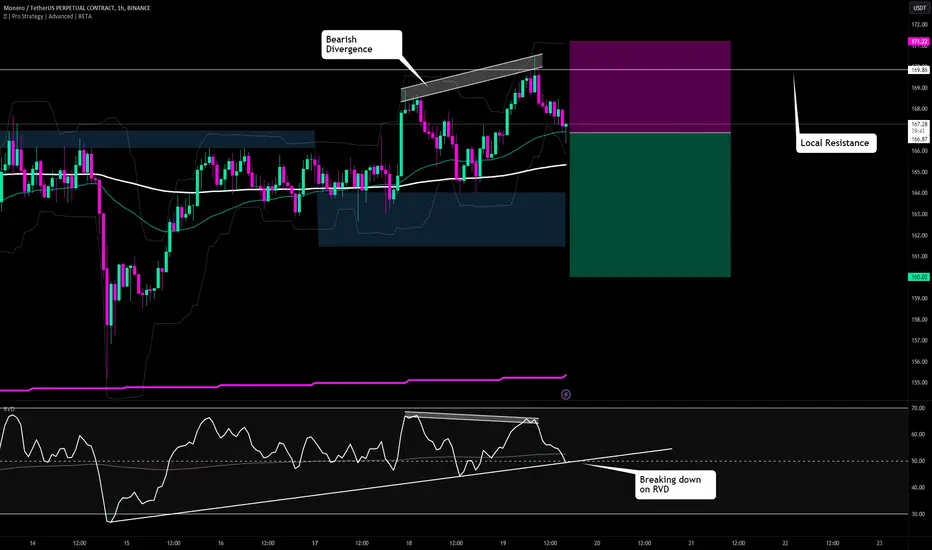
BTC expected to test its lower range which will drop alts almost certainly if it does - XMR is looking like the best short set up at the moment with the bearish divergence and breaking down on the RVD.
XMRUSDT 240My opinion is that after breaking the trendline, a pullback has been broken to the region and is now forming a Saudi pattern.
BINGX:XMRUSDT.PS

#XMR/USDT - Long - Potential 7.04%Direction: Long
Market: Spot
Risk: 0.25% - 1%
#USDT_XMR
Exchange: BINANCE
Timeframe: 360
TP1: 177.9
Entry: 166.7
STOP: 155.5
Entry Conditions:
| Bottom of consolidation range
| Trendline break - w/ volume
| RVD trendline break
Added a second earlier take profit where I might liquidate the position depending on how price responds when it hits the overhead resistance that has so far defined this range.

xmr for spot tradersBINANCE:XMRUSD.P has potential to give 100% profit in long position , if you are spot traders , or if you work with below leverage you can check and take it.

XMR getting ready to move 80 - +100%Bullish Divergence that spans across the period of 3 years.
RSI indicating market exhaustion from the bears. Meaning the bulls are about to reclaim control
Stochastic showing signs of being oversold
Triple bottom bouncing off a major demand zone on the weekly time frame and wicks the downside indicating a 80 - 100% ROI potential move in the months and year to come.

XMR getting ready to move 80 - +100% Bullish Divergence that spans across the period of 3 years.
RSI indicating market exhaustion from the bears. Meaning the bulls are about to reclaim control
Stochastic showing signs of being oversold
Triple bottom bouncing off a major demand zone on the weekly time frame and wicks the downside indicating a 80 - 100% ROI potential move in the months and year to come.

Bearish Breakout Signals XMR's Potential Downward MoveXMR has recently experienced a bearish breakout from the distribution zone established on the hourly timeframe. Following the breakout, there was a subsequent pullback, suggesting a potential continuation of the bearish trend toward the indicated key zone.

$XMR BullRun is coming?!?!History often rymhes and now we see monero at a critical resistance point after having reachead is tail emission phase in 2022.
Is another 7x for monero coming?
If Bitcoin is digital blockchain gold and Ethereum programmable internet money ONLY MONERO deserve the nomination for DIGITAL FULLY FUNGIBLE CASH.
His market cap is way undervalued and it's blockchain is resiliant and unstoppable>
When the market is going to price in that?
CBDC are coming , world control of your money is coming and only Monero is real financial fredoom.
Low fees , fungible 100% and secure. Wordwide tradable .

Trying the Market Maker ModelFor the last few days on ICT, I been looking at the Market Maker Model, so there is my version of the same market maker model. #XMRUSDT.P

XMRUSD ❕ decline after the resistanceXMR repeatedly failed to break resistance.
The asset broke down through the 50EMA on the 4H TF.
RSI fell below 50 points.
I think the chart will continue lower after fixing under the support level.

XMR/USDT Let's get ready for this one! Hey traders 👋
XMR/USDT pair has had a nice 3 touch on that upper resistance which could lead to a good turnover here with a potential 30-40% drop. RSI is overbought as well so we are definitely keeping an eye on this one!
If we see this kind of struggle more then there is a good chance for a drop to happen!
If you like ideas provided by our team you can show us your support by liking and commenting.
Yours Sincerely,

Downing to Support at $155 | LONG BiasDaily Chart
Monero's ( BINANCE:XMRUSDT ) pulling back to Support Zone around $155
I expect Monero will go up Swing High at $172 and further at $212
Wait and see the next move

XMR, ancient coin | $212On weekly chart,
Monero BINANCE:XMRUSDT is in consolidation phrase.
It's trading at $164.8 now
I expect Monero will move up to $212 to complete 1.0 Fib Ex and 119.5% from $96.7
Wait and see

SELL Monero, Not Quite, Not YetSince monero broke it's 164.60 support level on Feb 9th 2023, it has attempted to break this level in March and April and failed. Monero then retested the support level of 137.60 which was formed on December 28th 2022 and has been testing and holding multiple times.
Fast forward -for the last 6 days Monero has reformed and has been consolidating and holding the now reformed support level for the first time in 5 months
Once monero continues holding 164.60 or 151.90 it will pump. Keep the hodl bag

XMR/USDT looking good for a turnover! Hey traders 👋
XMR is next on our watchlist here with a nice bullish moves recently! After showing us a breakdown of lower trend and at the same time turning it into a liquidation zone we went straight up for that upper zone where price is currently waiting behind the line just as it it might go or a breakout there! We are going to look and keep our eyes open here and be also open minded as we can have two potential movements here!
First movement - we might see a nice breakout and go for that liquidity grab zone from where on we are going to look for a turnover and a sell position!
Second movement - price will reject and respect that upper line of triangle formation and go straight towards that lower zone!
If you like ideas provided by our team you can show us your support by liking and commenting.
Yours Sincerely,
Swallow Team
Disclamer:
We are not financial advisors. The content that we share on this website are for educational purposes and are our own personal opinions.


$XMR reclaimed 200 ema on H4
approaching key resistance or confluence of 200 ema on W1 and downtrend
recon we flip it.
BTC pair still has a lot of catching up to do so assuming dominance gets sent to hades and this pop's

XMRUSD ❕ held the uptrend lineXMR exited the downward channel, formed an uptrend line and formed a bullish takeover.
Price has fixed above 50EMA (4H TF)
50EMA has broken up 200EMA (1H TF)
The RSI chart is moving in a buy zone (4H, 1H and 30m TFs)
I believe the asset may continue to rise after fixing above the resistance level.
