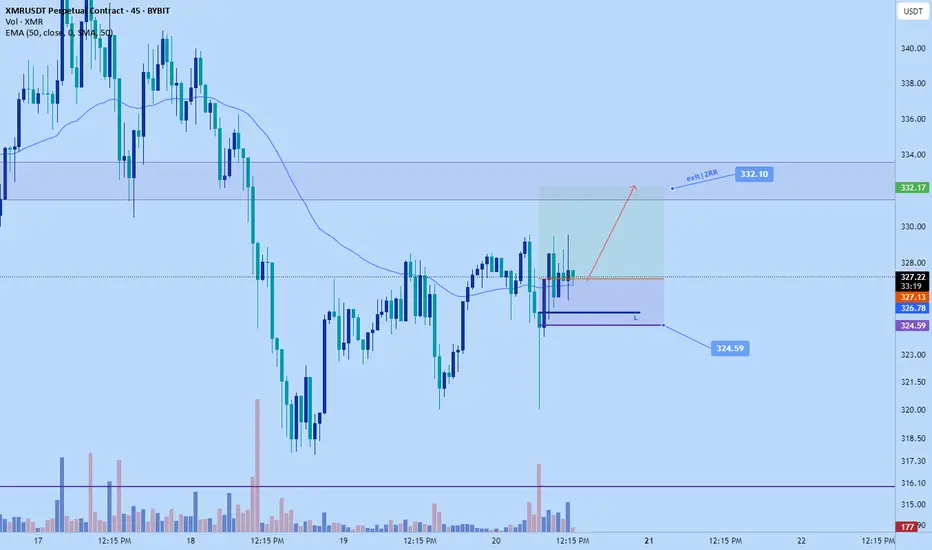
Monero scalp long to $332.1Sl: $324.59 or lower
TP: $33210
Just aiming for a quick 2RR on monero. I think it might have some trouble to break back above $332.10 we got quite a bit of sell of from that area recently.
Time sensitive
DTT analysis applied.
XMRUSDT trade ideas
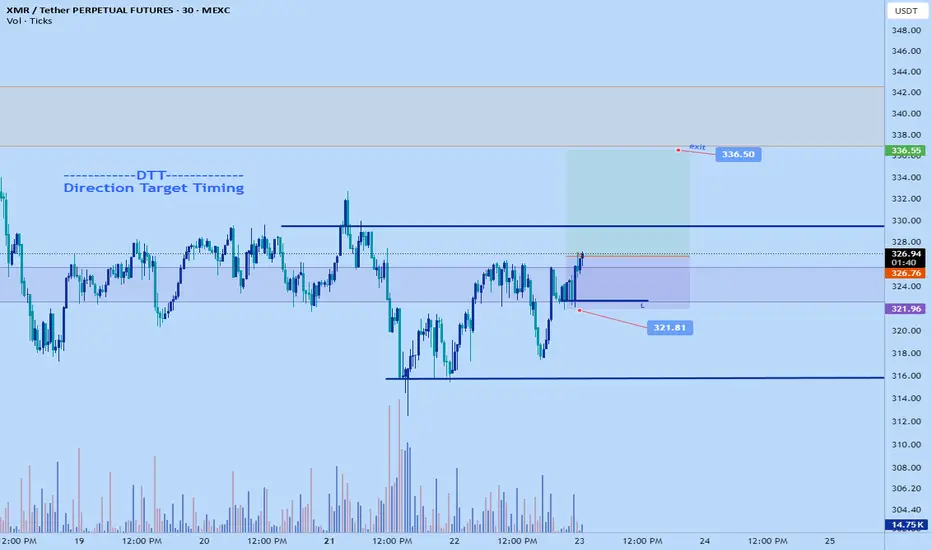
Monero long to $336.5Just now opened up a long position on monero.
Aiming for $336.5
Sl: $321.81 or lower
DTT strategy.
XMR Holds Key Support Zone, Eyes Bullish Rotation Toward $357Monero (XMR) is currently trading at a region of strong technical confluence, creating a solid foundation for a potential bullish reversal. If support holds, price could rotate upward toward the $357 high.
With several overlapping indicators and structural support aligning at this level, the probability of a continuation toward higher resistance increases, assuming momentum persists in the coming sessions.
XMR has found itself at a significant support region made up of multiple key technical elements. This area includes the point of control, daily support-resistance (SR), VWAP-based SR, value area high, and a broader high-low structure level. These overlapping levels form a critical inflection point where price is attempting to base before a potential move higher.
The $357 level remains the next major target, but only if current support holds firm. From both a volume profile and structural standpoint, Monero is showing signs of a bullish bias as long as this region is not lost.
Key Technical Points
- Multi-Layered Confluence Zone: Includes point of control, VWAP SR, daily SR, and value area high
- Current Price Structure: Holding above key support, indicating bullish potential
- $357 Target in Focus: A potential rotation target if support continues to hold and reversal forms
Monero’s price action has entered a highly reactive zone. This region is not only home to the point of control from the current range but also aligns with a daily support-resistance flip, VWAP-based levels, and the value area high. Structurally, the zone also represents a midpoint between recent high and low swings, adding further technical weight.
From a structural perspective, price is holding above this level cleanly for now, which suggests buyers are stepping in to defend the area. If XMR continues to print higher lows on the lower time frames and remains above the point of control, a bullish rotation toward $357 becomes increasingly likely.
Volume behavior is relatively stable, and while there is no major spike yet, the support holding without breakdown is a positive signal. In previous market cycles, similar confluence zones have acted as springboards for price continuation. Therefore, the importance of holding this region cannot be overstated.
To maintain this bullish scenario, XMR needs to stay above the point of control with confirmation through price acceptance and possible breakout structures in the lower time frames. Any strong close below this area could invalidate the short-term bullish case and reintroduce downside pressure.
What to Expect in the Coming Price Action
If XMR holds this confluence region over the coming days and establishes a reversal structure, the stage is set for a push toward the $357 resistance zone. As long as the point of control remains intact, the likelihood of a bullish continuation increases significantly.

XMR/USDTKey Level Zone: 330 - 333
LMT v2.0 detected.
The setup looks promising—price previously trended upward with rising volume and momentum, then retested this zone cleanly. This presents an excellent reward-to-risk opportunity if momentum continues to align.
Introducing LMT (Levels & Momentum Trading)
- Over the past 3 years, I’ve refined my approach to focus more sharply on the single most important element in any trade: the KEY LEVEL.
- While HMT (High Momentum Trading) served me well—combining trend, momentum, volume, and structure across multiple timeframes—I realized that consistently identifying and respecting these critical price zones is what truly separates good trades from great ones.
- That insight led to the evolution of HMT into LMT – Levels & Momentum Trading.
Why the Change? (From HMT to LMT)
Switching from High Momentum Trading (HMT) to Levels & Momentum Trading (LMT) improves precision, risk control, and confidence by:
- Clearer Entries & Stops: Defined key levels make it easier to plan entries, stop-losses, and position sizing—no more guesswork.
- Better Signal Quality: Momentum is now always checked against a support or resistance zone—if it aligns, it's a stronger setup.
- Improved Reward-to-Risk: All trades are anchored to key levels, making it easier to calculate and manage risk effectively.
- Stronger Confidence: With clear invalidation points beyond key levels, it's easier to trust the plan and stay disciplined—even in tough markets.
Whenever I share a signal, it’s because:
- A high‐probability key level has been identified on a higher timeframe.
- Lower‐timeframe momentum, market structure and volume suggest continuation or reversal is imminent.
- The reward‐to‐risk (based on that key level) meets my criteria for a disciplined entry.
***Please note that conducting a comprehensive analysis on a single timeframe chart can be quite challenging and sometimes confusing. I appreciate your understanding of the effort involved.
Important Note: The Role of Key Levels
- Holding a key level zone: If price respects the key level zone, momentum often carries the trend in the expected direction. That’s when we look to enter, with stop-loss placed just beyond the zone with some buffer.
- Breaking a key level zone: A definitive break signals a potential stop‐out for trend traders. For reversal traders, it’s a cue to consider switching direction—price often retests broken zones as new support or resistance.
My Trading Rules (Unchanged)
Risk Management
- Maximum risk per trade: 2.5%
- Leverage: 5x
Exit Strategy / Profit Taking
- Sell at least 70% on the 3rd wave up (LTF Wave 5).
- Typically sell 50% during a high‐volume spike.
- Move stop‐loss to breakeven once the trade achieves a 1.5:1 R:R.
- Exit at breakeven if momentum fades or divergence appears.
The market is highly dynamic and constantly changing. LMT signals and target profit (TP) levels are based on the current price and movement, but market conditions can shift instantly, so it is crucial to remain adaptable and follow the market's movement.
If you find this signal/analysis meaningful, kindly like and share it.
Thank you for your support~
Sharing this with love!
From HMT to LMT: A Brief Version History
HM Signal :
Date: 17/08/2023
- Early concept identifying high momentum pullbacks within strong uptrends
- Triggered after a prior wave up with rising volume and momentum
- Focused on healthy retracements into support for optimal reward-to-risk setups
HMT v1.0:
Date: 18/10/2024
- Initial release of the High Momentum Trading framework
- Combined multi-timeframe trend, volume, and momentum analysis.
- Focused on identifying strong trending moves high momentum
HMT v2.0:
Date: 17/12/2024
- Major update to the Momentum indicator
- Reduced false signals from inaccurate momentum detection
- New screener with improved accuracy and fewer signals
HMT v3.0:
Date: 23/12/2024
- Added liquidity factor to enhance trend continuation
- Improved potential for momentum-based plays
- Increased winning probability by reducing entries during peaks
HMT v3.1:
Date: 31/12/2024
- Enhanced entry confirmation for improved reward-to-risk ratios
HMT v4.0:
Date: 05/01/2025
- Incorporated buying and selling pressure in lower timeframes to enhance the probability of trending moves while optimizing entry timing and scaling
HMT v4.1:
Date: 06/01/2025
- Enhanced take-profit (TP) target by incorporating market structure analysis
HMT v5 :
Date: 23/01/2025
- Refined wave analysis for trending conditions
- Incorporated lower timeframe (LTF) momentum to strengthen trend reliability
- Re-aligned and re-balanced entry conditions for improved accuracy
HMT v6 :
Date : 15/02/2025
- Integrated strong accumulation activity into in-depth wave analysis
HMT v7 :
Date : 20/03/2025
- Refined wave analysis along with accumulation and market sentiment
HMT v8 :
Date : 16/04/2025
- Fully restructured strategy logic
HMT v8.1 :
Date : 18/04/2025
- Refined Take Profit (TP) logic to be more conservative for improved win consistency
LMT v1.0 :
Date : 06/06/2025
- Rebranded to emphasize key levels + momentum as the core framework
LMT v2.0
Date: 11/06/2025
- Fully restructured lower timeframe (LTF) momentum logic
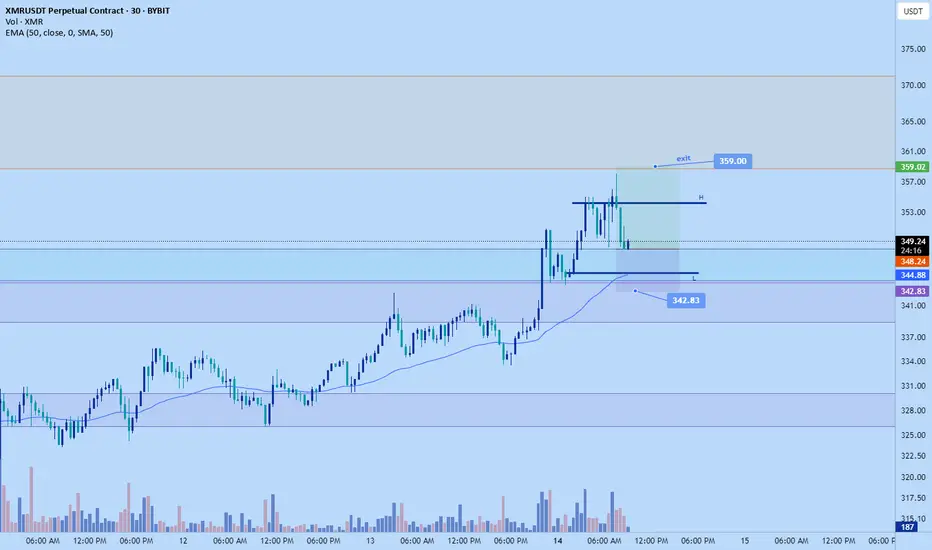
Monero pump to $339 soonJust now went long on monero.
Stop: $321.58
Tp: $339
3RR trade.
Surprisingly the pa on monero right now is slow. I think structurally its at a good low point. It did just break the 1hr HL structure but i think its fakeout. Besides the market will likely correct to make a LH still even if not a fakeout so odds are it will likely push a bit.
Based on the overall market momentum as well with everything pumping I think monero can at least push to $339. It spiked up to that point last week and I think the bulls more than likely will attempt to push it again.
Other than that it aligns with my DTT strategy

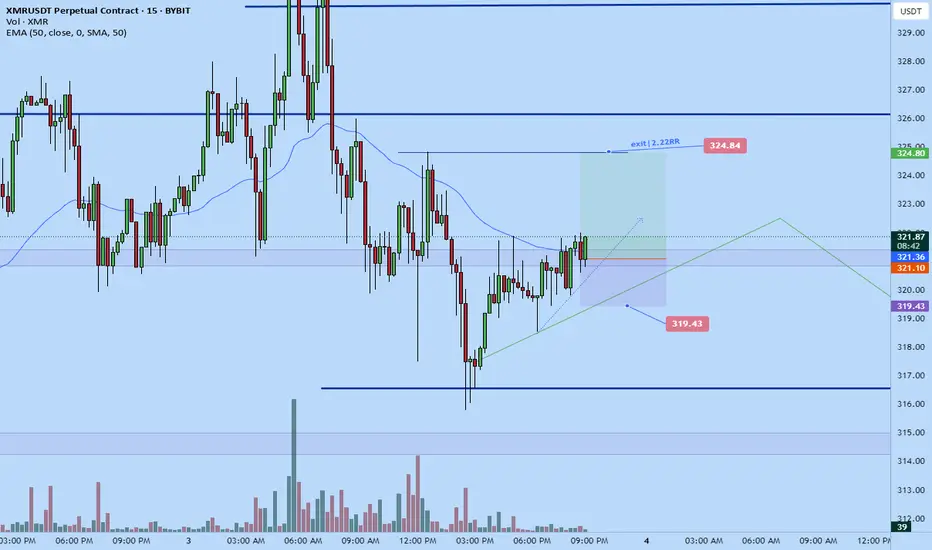
Monero long to $324.84Just recently opened up a long position on monero. Targeting $325
2RR trade.
Time sensitive
DTT setup
Monero (XMR): Buyers HAVE TO Secure 200EMA | Bullish!Monero is still trading below the 200EMA, which we have been monitoring, as we are waiting for a breakout to happen near this region, which would then give us a good entry for upward movement.
In order to get into trade, we need to see a proper breakout from here so that's what we are waiting for right now!
Swallow Academy

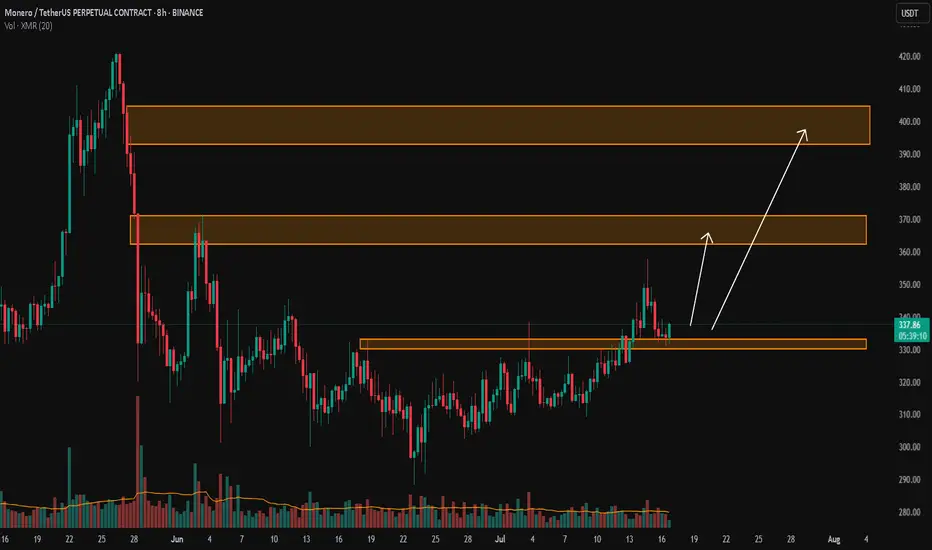
XMR Long Swing Setup – 50% Retrace with Structure ShiftXMR rallied from $200 to $400 and has now pulled back 50% of that move. With price reclaiming the 20-day SMA and a recent structure shift, there’s a solid setup forming with ~60% probability of continuation.
📌 Trade Setup:
• Entry Zone: $305 – $315
• Take Profit Targets:
o 🥇 $360
o 🥈 $400
• Stop Loss: Daily close below $300

Is XMRUSDT About to Explode? Key Levels to WatchYello, Paradisers! The recent ABC correction on #XMR has officially wrapped up, ending with a textbook Ending Diagonal pattern. And you know what that usually means: a reversal is cooking, and the bulls might just be sharpening their horns for a comeback.
💎The current resistance zone sits between $325 and $330, and this level will be the first real test for the bulls. If momentum is strong enough, price could see an immediate breakout. However, there’s also a high chance this area forms a classic inverse head and shoulders pattern first, a setup that would give us an even stronger confirmation of reversal once the neckline breaks above $330. This is where smart money will be watching closely.
💎Once #XMRUSDT manages to break through $330 with convincing volume, the next upside target becomes $360 to $370. This isn’t just another resistance level, it aligns with the 50% and 61.8% Fibonacci retracement, making it a high-confluence zone. Expect strong profit-taking activity here, which could trigger volatility or short-term pullbacks
💎On the downside, moderate support exists between $300 and $305, which should act as a buffer against short-term pressure. It’s likely to hold unless broader market sentiment shifts sharply.
Paradisers, strive for consistency, not quick profits. Treat the market as a businessman, not as a gambler.
MyCryptoParadise
iFeel the success🌴

XMR BEARISH SETUPWith the recent bearish momentum we have witnessed a breakout on support and the recent pullback can trigger another selling pressure as a continuation of the major bearish trend to the downside.

Monero might finally dump to $290Monero might finally dump to $290 this weekend.
Trend is down on daily weekly looks like its in need of more correction still. 4hr is bullish but at HH point. 1hr structure bullish as well but breaking support- early sign that its likely to break back bearish to the down side.
Stops TP s on chart.

Monero cycle top idea Time + price based projection of xmr top idea.Fib based time projection and price extrapolated on trend.Recovery based on fractal of action potential

Monero scalp longJust opened a long position on monero. Market likely to correct up before continuation down based on my DTT analysis.
Time sensitive
Stop: $306.03
Tp: $313.9 arewa

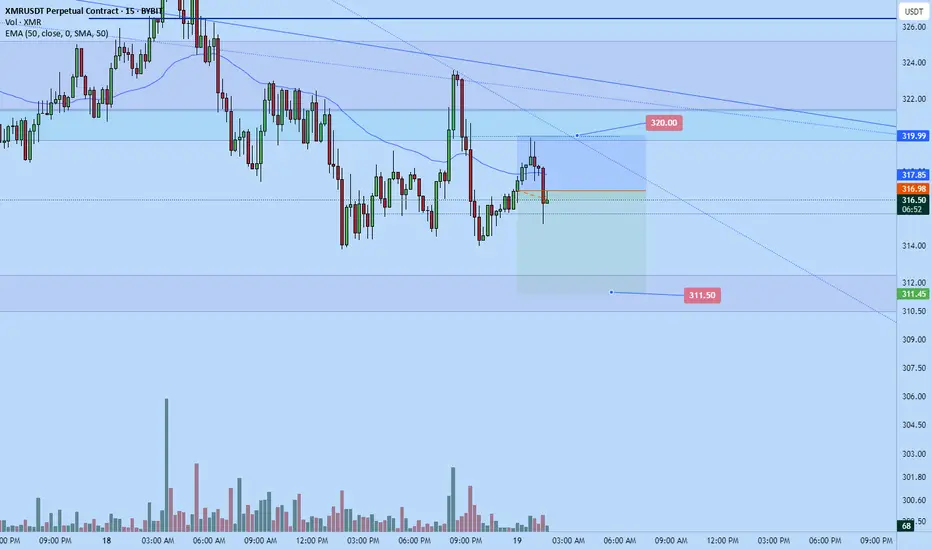
Monero scalp short to $311.5Just hopped into this monero short.
Scalping to $311.5
Market likely aiming for lower lows soon as it needs to break in order to test daily support.
Time sensitive.
Monero $290 inevitable DumpMonero short
Target: $290, its inevitable but its been taking its time. Might finally break down today, bears appear to be piling in.
Stop: $323.45
Roughly 2.9 RR
Conservative trade, stop isn't too tight, don't have to micro-manage much. Added a 0.5% risk on it for myr Hyro account.
ETA for trade to play out...Possible today if get strong bearish volume around weekly close. Otherwise not sure, could take a day or 2-monero can be annoying at times but when its ready to drop it'll move fast.

Monero short to $290Just went short on monero. My edge have appeared and am happy to take this one.
Been eying it for a while. Seems the time is near.
Expecting $290 this weekend.
Roughly 3RR
Stop: $317.34

Monero short to $311Opened a short on monero not too long ago.
Stop: $334.5 or higher
Tp: $311
Roughly 3RR.
DTT setup
Market likely to try to make a new lower low soon.

Monero pump to $341 today!monero limit long order
Limit entry: $329.5
Stop: $324.4
Target: $341
2.3RR roughly
xmr/usdt
DTT strategy applied- except using limit order for entry because with this setup its just about getting a good low entry with at least 2RR and very good invalidation stop.

Monero scalp pump to $331 areaJust now hopped into monero long ticker xmr/usdt
Stop: 319.45 or lower
Tp: 331 area
2.5RR+
Time sensitive. Expecting pump just about now.

PAR indicator using the scalp ribbonPAR indicator using the scalp ribbon. Following the larger trend to take your entries.

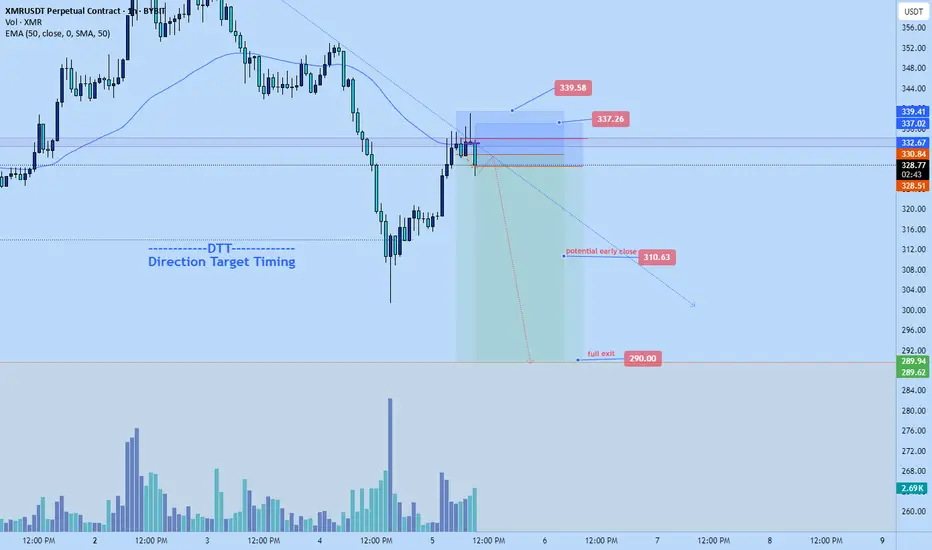
Monero dump back to $290Recently opened a short position on monero. Its currently structurally high on the weekly tf and a pullback is in effect.
Am anticipating it will fall down to $290...however, this is bybit chart which seems to have added monero later theres is actually a level around $310-315 area where it might reverse from so that's like potential early close.
I have alert set there. Looking to hold towards $290 if all is going according to plan though
XMRUSD( Monero ) - H1- LONGThe XMRUSDT 1-hour chart on TradingView shows a promising setup for a buy position. A clear trendline break and retest pattern is visible, with the price breaking above a descending trendline and retesting it as support before moving higher. Additionally, the wave structure supports the bullish outlook, forming an N-wave pattern—a key formation in Ichimoku wave theory—suggesting a strong upward impulse. The combination of the trendline break, retest, Ichimoku cloud confirmation, and N-wave formation makes this a solid setup for a buy position.
If you like the analysis, don't forget to like, share, and comment, and I'm looking forward to your constructive feedback!
