Monero Wave Analysis – 30 May 2025- Monero reversed from round resistance level 400.00
- Likely to fall to support level 300.00
Monero recently reversed down from the powerful round resistance level 400.00, standing far above the upper daily Bollinger Band.
The price will form the weekly Japanese candlesticks reversal pattern Bearish Engulfing if it closes this week near the current levels – strong sell signal for Monero.
Given overbought reading on both weekly RSI and Stochastic, Monero can be expected to fall to the next round support level 300.00.
XMRUSDT trade ideas

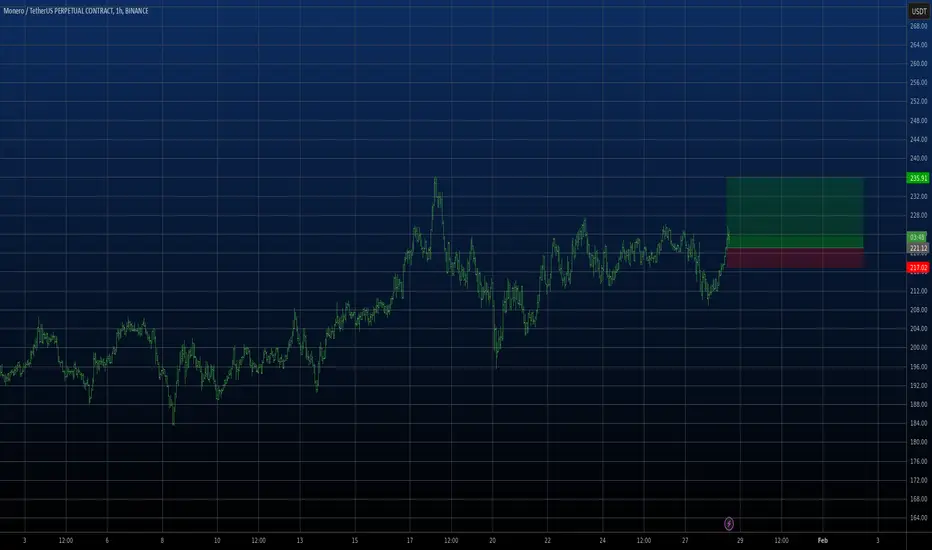
XMR | Long | Privacy Sector Rebound | (May 28, 2025)XMR | Long | Privacy Sector Rebound + Reversal Setup | (May 28, 2025)
1️⃣ Quick Recap: Monero (XMR) stands out in today’s crypto landscape for what it was originally built to protect — privacy. Amid rising regulation and surveillance in digital assets, XMR offers a decentralized, untraceable alternative. Technically, the chart is forming a curved base pattern, suggesting a potential reversal is near. We're looking to accumulate in a key zone and ride the recovery. 🔒📈
2️⃣ Trade Parameters:
Bias: Long (Spot position for long-term value)
Entry Zone: $211–$240 (VWAP + Value Area High support)
Stop Loss: Below $211
TP1: $275
TP2: $419
TP3: $559
Partial Exits: 275, 419, 559 (based on structure and volume response)
3️⃣ Key Notes:
✅ Sector: Privacy Coins — Monero leads this niche
✅ What Makes It Unique:
– Decentralized digital currency that prioritizes privacy and anonymity
– Solves the transparency flaw in BTC-like chains where all transactions are publicly traceable
– Offers full fungibility, meaning no unit is "tainted" by past use — every XMR coin is equal
✅ Competitors like Zcash may offer some similarities, but Monero remains the OG in privacy tech
✅ Strong liquidation levels seen around $263 make the $211–$240 range attractive for a sweep + reversal play
❌ A breakdown below $211 would invalidate this idea and suggest more downside or reaccumulation
4️⃣ Follow-Up: With privacy coins back in focus, Monero has the potential to break out again — possibly above $1K in the longer term. Will update this trade as price approaches key TP levels or if market sentiment shifts.
Please LIKE 👍, FOLLOW ✅, SHARE 🙌 and COMMENT ✍ if you enjoy this idea! Also share your ideas and charts in the comments section below! This is best way to keep it relevant, support us, keep the content here free and allow the idea to reach as many people as possible.
Disclaimer: This is not a financial advise. Always conduct your own research. This content may include enhancements made using AI.f

potential upcoming dip followed by bullish upward movepotential upcoming dip followed by bullish upward move

XMR $288 would be fair supportLooking at the chart of XMR , I think we need to find a support and accumulation phase , $288 would be fair support

XMRUSDT broke resistance, waiting for consolidation XMRUSDT is consolidating against the background of an upward (bullish) trend. The coin reacted weakly to yesterday's bitcoin pullback and is testing consolidation resistance with the aim of continuing growth
Scenario: at the moment the price makes a breakout of 401.65. Consolidation of the price above the level will confirm the intentions of buyers to go to the intermediate target of 440.0. Price consolidation above the consolidation will strengthen buying, which may trigger growth

Reasons for Monero's Price Increase
High demand for privacy: With increasing regulation and privacy concerns, Monero's anonymity features are highly sought after.
Protection against quantum hacking: The upcoming FCMP++ upgrade will significantly enhance the network's resistance to potential attacks from quantum computers.
Use in covert operations: Monero's utilization for laundering large sums (e.g., after the $330M Bitcoin theft) highlights its effectiveness in ensuring anonymity.
Increased miner activity: Monero mining has reached an all-time high, signaling heightened interest and activity within the network.
Technical Analysis
However, it's highly likely that Monero's price surge has ended. Technical indicators point to the asset being severely overbought. On the weekly timeframe, the RSI was already above 86%. A bearish divergence has appeared on the daily timeframe.
Idea
The emergence of bearish patterns could be a strong signal for opening a short position.

Monero (XMR): Possible Long Squeeze ComingMonero coin has been having a lot of long squeezes (on smaller timeframes we can see more of them), which is giving us the option of another upcoming long squeeze happening.
We are basing our theory on the current market state and the price movement of XMR, where we are overexpanded currently, which would be the ideal place for a quick reset.
Swallow Academy

Binance Coin AKA BNBAs the Crypto market looks to turn Bullish and create new ATHs
BNB also looks to set itself for a bullish run
With this one not as expensive as BTC, we might see it going up without proper market structure
As we saw with Monero

Monero Wave Analysis – 29 April 2025
- Monero broke resistance area
- Likely to rise to resistance level 300.00
Monero cryptocurrency recently broke the resistance area between the resistance level 240.40 (former multi month high from the start of this year) and the resistance trendline of the weekly up channel from the middle of 2024.
The breakout of this resistance area accelerated the active short-term impulse wave 5, which belongs to wave (3) from the start of 2024.
Given the clear weekly uptrend, Monero can be expected to rise toward the next round resistance level 300.00.

Perfectly wyckoffed XMRUSD produce beautifull set of higher higsPOLONIEX:XMRUSD
A textbook Wyckoff bottom accumulation just happened.
Easy 200% gains are on the table—right now. Check it out on the sc profile.
Think about it: What are the whales who were buying between 2022 and 2024 planning to do with the price?
Sure, Monero is being delisted from more exchanges lately. Some might see that as bearish, but it gives whales more control over the price since liquidity is lower.
I'm in for quite some time. But it is not too late for you. ;)
Strategy?
Either sell 50% of the position at 180% profit and hold the other half for 1.5 years.
Or hold all for 2 years.

Monero possible Swing play- price action has been consolidate for long time now start to breaking out.
- holding well above 13 ema weekly
- there is golden cross possibility.

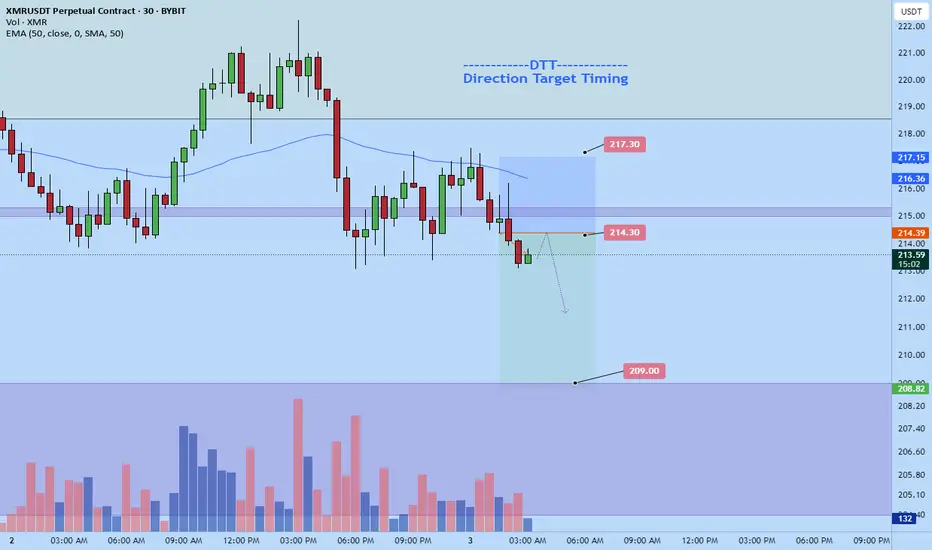
Monero Short to $209 within hoursJust set a limit order to short monero.
214.3 Limit entry
with stop at 217.3
Roughly 2 RR setup with target around $209
$XMRAs we can see all the conversation about privacy and entering the Golden age , Tornado Cash being taken on the sanction list , we can see a positive for $XMR. What do you guys think? Comment below

XMR Trend Daily TimeframeMonero is on a very strong uptrend look to make a cup and handle pattern on the weekly the next 3 months are looking very promising on OMXSTO:XMR Im Buying$$ Wave Anaylsis on the MACD has been printing green for a while on daily looking to reverse momentum to the upside

Xmr short to 230.4I just now opened an xmr short. My target is quite conservative.
$230.4 I do expect it to fall lower but am going to bed and won't be able to monitor.

XMR long to 250 This instrument is above 225, a round number, which is 1/4 of 300 and is moving to 250 (1/2). A very strong instrument compared to others and has a long trend.
XMR SL-$234,84 TP-$202Technical Analysis:
Diamond formation indicates a likely reversal
The risk-reward ratio is good enough to take the opportunity

Monero(XMRUSDT) SL-$212,29 TP-$240Technical Analysis:
False lows indicate bullish strength
Compression at the upper limit of the range announces an explosion of volatility
Tenkan-Kijun crossover on the daily chart
20-50 EMAs crossover on H4
MACD aligned on the daily chart
Additional Note:
The behavior of Monero is always unusual, but it tends to respect price ranges and compressions. Another detail is that it's the only altcoin to have independence from BTC movements, and it continues to grow despite governmental persecution.

XMR USDT💰 #XMR hit the accumulation zone and bounced back up quickly 👌
Additionally, we have a Falling Wedge breakout forming 🧐
IMO, this is the dip for OMXSTO:XMR before a major rally! ✈️🚀

Long MoneroThe good moment for buy Monero on the Up side of flat channel. I think the moment is good for brake it Up and move to test the local highest high. With small loss it can be good risk reward trade. Will see...
XMR/USDT NEW VOLUMEXMR/USDT NEW VOLUME
It is able to show new uptrend volume in the coming time on day trade.

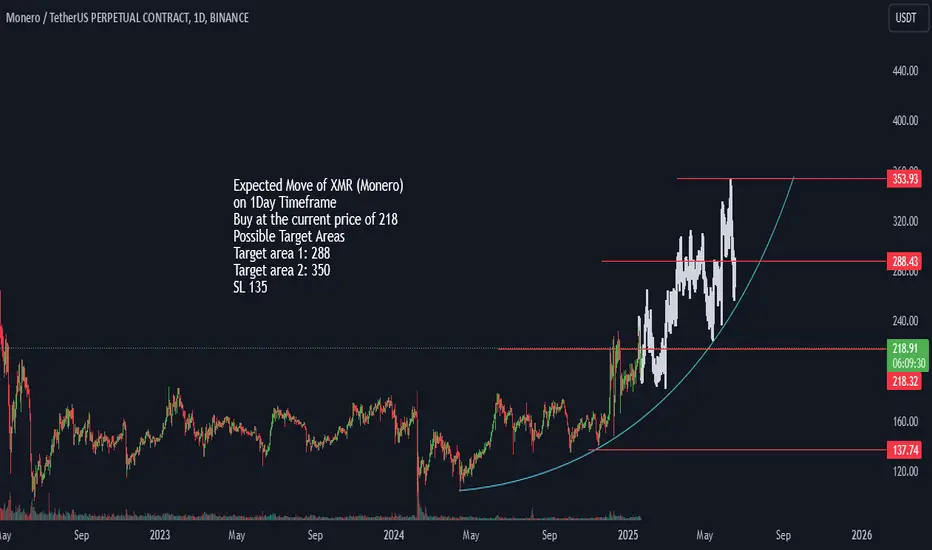
XMRUSDT Long IdeaExpected Move of XMR (Monero)
XMR Broke the previous High and possible to make a curve move on 1D TF
on 1Day Timeframe
Buy at the current price of 218
Possible Target Areas
Target area 1: 288
Target area 2: 350
SL 135
LONG on XMR/USDTI'm opening a long position on XMR/USDT based on a broader market narrative. As regulatory frameworks around cryptocurrency are expanding globally, privacy coins like Monero (XMR) stand to benefit significantly.
With privacy-focused features becoming increasingly valuable in a regulated landscape, Monero could experience substantial growth. From a technical standpoint, the chart shows , aligning with this fundamental view.
Targeting with a stop-loss at to manage risk.
Let's see how this idea plays out! 🚀
What do you think of this analysis? Feedback is welcome!
