XMR Monero LongXMRUSDT had consolidation on H1 TF, After that price had breakdown to liquidate buyers. buyers are already dead now it's time for a little uptrend to kill shorters from previous consolidation. Approximately it is $250-255.
XMRUSDT trade ideas

Open Short Position on XMRUSDT!I dont know why I lost the XMRUSDT and didn't continue to track it. Did you remember my Idea on this coin? I should follow it after cross over out the Chanel!!
I opened the Short position just few Minutes ago in order to study more about its price movement.

Monero | The Market Loves MoneroMonero | The Market Loves Monero
The price is moving within this triangle pattern since Bitcoin began the bearish movement.
As you can see Monero looks like it is a favorite pattern as long as the price is making up and
downs by 10% to 12% within the triangle pattern.
The market doesn't want to let it move lower.
However, considering that the pattern can break out on both sides we have to consider both scenarios.
Thank you and Good Luck!


XMR/USDT
W pattern which is a double bottom , i have measured the potential target, nice volume coming in too.

$XMR 1HR Range$XMR performing well against the market today, but looks to be ranging after seeing resistance at former highs. RSI following the same range, with MACD looking to roll over to bear momentum for now.
Has performed substantially well all things considered.
I personally hold $XMR long term, just want to disclose that whenever I look at a coin I hold.

XRM is Ready For SHORT PositionXRM /USDT is Going to get a good setup for SHORT POSITION
you can get this position with LEV15 X
Good Luck & dont forget to set SL & TP


XMR / USDT✅We are providing an analysis with the specific period of time. Pay attention to the expiration date.
📌Stay faithful to the Stop-Limit at all times.
👍(If you find this post useful, give it a thumbs up, share your thoughts in the comments, and feel free to spread the word)


long MONERO$XMR is bouncing off the support level. Bullish movement to the resistance level at 243$ is likely to happen.

XMRUSDT UPDATEMonero multi timeframe price action analysis - waiting for a third push into HTF supply before looking for valid short entries on the LTF.

XMR breakout Ascending wedge 🤓✅✅✅🤓Hi dear traders
Price breakout descending wedge, now can rise to near 230$ resistance as target.
Otherwise go down to support area specified.
This is not financial advice ( DYOR )
Good luck.

Monero Completing Potential Zigzag Elliott Wave PatternXMR looks like it is completing a potential zigzag where wave-c is only about 62% of wave-a. This implies that the entire zigzag should get retraced and we should see a powerful move to new all time highs.
Wave-c is also a potential terminal impulse which means it should be retraced very quickly. To confirm the terminal impulse we must retrace all of wave-c faster than it was formed, and it will likely happen in less than 25% of the time of wave-c.
We've already slightly broken the 0-b trendline so if this gets some follow through we could see a fast move up to new all time highs.
The timing of all waves is virtually perfect and basically all rules are followed from a price, time and structure perspective.
This comes at a time of extremely heightened privacy concerns regarding sanctions targeting Russian crypto addresses and Canadian asset seizures targeting vaccine mandate protestors. Monero is the oldest and most trusted privacy coin, as well as the most liquid and most widely used in dark net commerce so it has several advantages, especially for larger entities like Russian elites who want to avoid sanctions. Based on this I have a feeling XMR could do well at least in the short-term but potentially in the longer-term as well.
There's also very large bullish momentum divergences forming that indicate a large move to the upside could be happening soon.
Potential targets depend on how quickly wave-c and the entire zigzag are retraced. It's possible that this is a triangle wave-c instead of a terminal, meaning it would be followed by a d-wave, though this seems unlikely. If we a get a wave-d then it won't break all time highs and wave-c likely won't be retraced faster than it was formed. If we get a fast retracement then this should go to around 3k at minimum, but depending on the long-term could even go as high as 20-100k in a few years.


XMR more upside likelyWeekly failed to make a higher swing high. Daily did.
However candles aren't like a swing failure and look more like engineered liquidity above.
Price currently in discount region with a 4h bullish sfp. Quite promising, but the safer approach would be to wait for the next daily higher low.


XMR one of the hottest coins nowDue to its privacy characteristics, XMR Monero is one of the hottest cryptocurrencies to own right now.
I expect the support to hold a from which it can bounce to the $287 resistance.
Looking forward to read your opinion about it.

XMR is getting closer to perfect buy zone!!!!!!! (Not-Trade-Advice)
Hello guys, as the bad movements of the market lately XMR is staying strong like a solid rock. As you see on the chart it had break its descending triangle and got supported on the upper trend line of the formation itself.
On the daily chart there must be a support of the daily 200ma price about 204-208$ and it will be our buy zone. For fib levels; those prices are in golden pocket zone. That means with 200ma and golden pocket supports gonna
give XMR a good opportunity for Long Positions.
I wrote Stop-lose and take profit prices. They are situational but i dont think they will be changed too much. I'll update my analysis.
See you soon
(Not-Trade-Advice)

XMRUSDT - 4h Long Signal💡💡#SIGNAL💡💡
XMR / USDT
▶️ BUY NOW + Block
🔴 SLT - 4h (Trigger)
#XMRUSDT_4h_290422

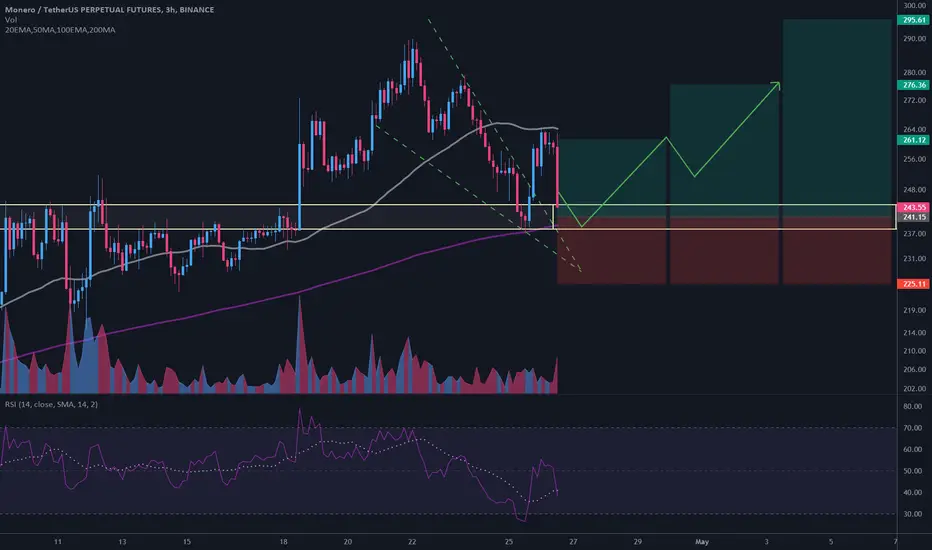
$XMR/USDT 3h (#BinanceFutures) Falling wedge breakout and retestMonero is pulling back to 200MA support and looks good for a bounce after and resume bullish.
Current Price= 243.55
Buy Entry= 244.15 - 238.15
Take Profit= 261.12 | 276.36 | 295.61
Stop Loss= 225.11
Risk/Reward= 1:1.25 | 1:2.2 | 1:3.4
Expected Profit= +24.84% | +43.80% | +67.74%
Possible Loss= -19.95%
Fib. Retracement= 0.5 | 0.786 | 1.117
Margin Leverage= 3x
Estimated Gain-time= 2 weeks
Tags: #XMR #XMRUSDT #PoW #Mining #Privacy #Blockchain #Bytecoin #Hardfork
Website: getmonero.org
Contracts:
#Mainnet
#Secret secret19ungtd2c7srftqdwgq0dspwvrw63dhu79qxv88