xmr long hello Traders, here is the full analysis for this pair, let me know in the comment section below if you have any questions, the entry will be taken only if all rules of the strategies will be satisfied. I suggest you keep this pair on your watchlist and see if the rules of your strategy are satisfied. Please also refer to the Important Risk Notice linked below.
XMRUSDT trade ideas
#XMRUSDT#XMRUSDT 4H
After the announcement of delisting from Binance on February 6, Monero faced a 40% drop and the price reached Fibonacci 0.5 again. If it can overcome the Fibo level of 618, we can hope for the return of the price of this currency. February 20 will be completely removed from the Binance list, which is likely to drop again.
The price is now drawn between two support and resistance boxes, which must pass one of these areas to enter the next channel.

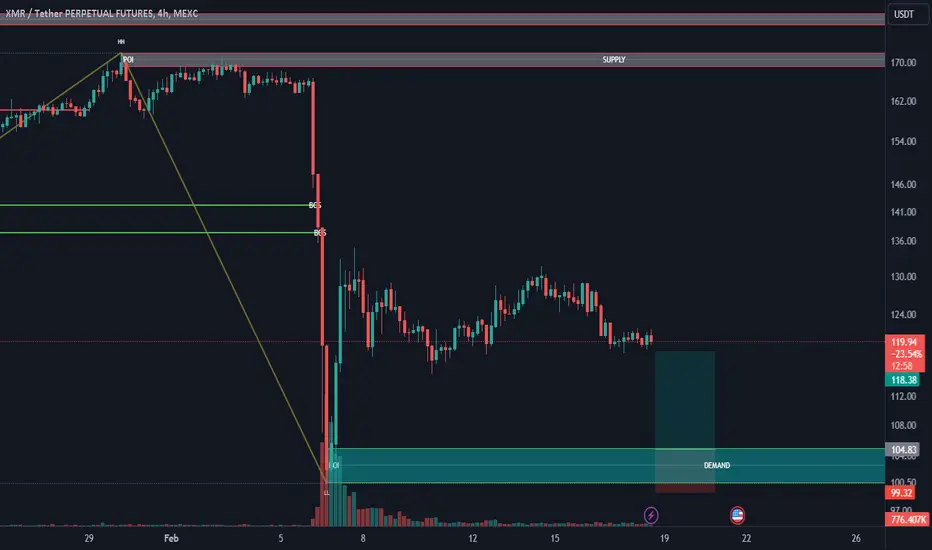
XMR LIMIT ORDERBYBIT:XMRUSDT.P
Goodmorning everyone, this morning I've been looking at the charts and to me XMRUSDT has made its bottom so that brings me to add a limit order on the last swing down to try catch the actual re-test. This is all depending on BTC at the moment as its just striking through the air and this could pop before it comes down although it's not too far off, I am confident we can grab this one for DAY TRADE 026.
LIMIT - 109.94
SL - 99.88
TP - 160.19
Thanks guys.


XMR short it againAfter the delisting news XMR went all the way to 100 only to bounce back after clarification from the XMR team. We see a strong downward from hereon.
First target: Blue line
Second Target: lower green line
Third Target: Bottom pit.

XMR - The STRANGEST (and EASIEST!) Chart 🤔📉Hi Traders, Investors and Speculators of Charts📈
If you have been following me for a while, you'll know I've been saying we are trading in the opening moments of a new bullish cycle. I've also referred to this as Elliot Wave Theory Wave 1.
Monero / XMR is an altcoin that still has massive upside potential for the coming bull season. But when analyzing Monero, I came across something rather interesting or strange; unique to the XMR chart - the candles follow a perfect quadruplet set of diagonal support lines!
Usually, and you may be more familiar with this, you will see horizontal support zones, for example:
But on the XMR chart, the trendlines of both support and resistance are diagonal, rather than predominantly horizontal like most other charts. After finally identifying this interesting trend, we can now readily set buy/sell zones. For example:
If you found this content helpful, please remember to hit like and subscribe and never miss a moment in the markets.
_______________________
📢Follow us here on TradingView for daily updates📢
👍Hit like & Follow 👍
CryptoCheck
CRYPTOCAP:XMR BYBIT:XMRUSDT.P BINANCE:XMRUSDT KRAKEN:XMRUSD

MONERO (XMR) showing a MASSIVE bullish divergence on the 1hr.MONERO is showing one of the largest bullish divergence gaps I've seen in a long, long time, after dropping about 40% in a day. This was obviously a coordinated attack to manipulate the price of XMR, as it is hated by the power's that be, because it can not be tracked, traced or controlled by their corrupt ring of criminal governments. Their pathetic attempt is now backfiring, as all they did was give XMR investor's the opportunity of a lifetime to buy even more XMR at the best discounted price they've probably seen in years.
If you trade this, trade with caution, as they could do it again.
Good luck and always use a stop loss.

XMRUSDT.PAfter a significant downward movement, when the price reaches the 4-hour Order Block (OB) and reacts to that level, possibly sweeping liquidity with that shadow, it presents a great opportunity for a buy.

XMR inteligentassetNow at 147 support by lower limit of the channel
bullish scenario
Resistances 161 in 50 ema, 170 horizontal, 180 pivot high, 206 upper limit channel
bearish scenario
Supports 137.7, 131.9 pivot low, 117.8

#1 XMR. The sleeping giant.XMR/USDT
Looking at the monthly on XMR, I can see it had a very strong buy back, it's looking very strong which means that most likely there will be MORE upside on it.
I expect to see $180 area acting as resistance, 4H trending to the upside meanwhile DAILY chart is preparing for a DEATH CROSS (55 and 389 EMA), I doubt it's gonna be a deathcross because it's holding the support for too many months now. This will have an impact most likely in the short term. Do not SHORT IT!

XMRUSDT Bullish Overture and Fibonacci FantasyAh, the Monero chronicles! Picture this: back in October 2023, XMRUSDT shattered the colossal triangle pattern that had been brewing for a whopping 500 days. It wasn't just a breakout; it was a seismic shift, a bullish beacon illuminating the medium and long-term horizon.
Fast forward to the aftermath—a robust pullback, precisely what the bulls ordered for that ideal entry point. But here's the kicker: XMR stood firm at the uptrend trendline, setting the stage for a potential turbocharged rally.
Now, be ready for the grand spectacle! We're foreseeing XMR setting its sights on the 161.8% Fibonacci resistance, an illustrious mark at the $225 checkpoint. The plot thickens—should this resistance be conquered, Monero has a captivating reward in store for its buyers: a delightful 60% gain.

XRM inteligentassetOn 7/1 bounce at 143 lower limit of channel
bullish scenario
Resistances 162 in 50 ema, 170 horizontal, 180 pivot high, 206 upper limit channel
bearish scenario
Supports 147 lower limit channel, 138 horizontal, 131 pivot low


XMR is going to moveHello everyone,
This is the last chance for #XMR to start moving to the upside.
But the bad news is that OBV shows weakness, which makes the situation complicated.
If it cannot hold this dynamic support, then we should expect more downside.
Cheers!
Mr. Cryptotracker

XMR Bullish Scenario XMR Bullish Scenario
Waiting for breakout of Ascending Triangle.
Will enter after breakout

XMR is bullishXMR is closing monthly November candle with very bullish price action which implicates there should be more upside in December.
Always manage your risk and use stoploss. Not a financial advice...

XMRUSDT - BULLISH REVERSALThe coin had been trending in a bearish trend printing series of LHs and LLs when a bullish div was made. It may start bullish trend now if indicated level is broken on upside. Buy stops may be placed.

Monero - XRM MoonshotMonero is another asset that no one has been interested in for over a year.
Yet there is clear accumulation going on, with a backtest of the old all time high as support as the first low and continuous higher lows subsequently.
You could size this up by having the last low as your invalidation point.
This asset looks incredibly promising, the only doubt is that it is taking a long time to play out, but so did XRP...

XMRUSDT In Bearish Descending ChannelPresently, XMRUSDT exhibits a bearish trend characterized by a descending channel pattern. Identifying the chart at a Lower High (LH) juncture, Initiated an immediate entry, establishing the preceding LH point as the stop loss. To determine Take Profit 1 (TP1), I utilized a 1:1 risk-reward ratio. Additionally, Take Profit 2 (TP2) was calculated based on a 1:2 risk-reward ratio.

XMR bullrun is nearIt is one of the symbols that is moving above 500 days in a limited RANGE. This symbol appears to be completing a very large diametric.
The green area is the strong bottom. Now it seems that we are in the last correction wave, that is, G from G.
The last corrective branch i.e. wave g of G is expected to be completed and the bullish wave will begin in the form of a large D wave
For risk management, please don't forget stop loss and capital management
Comment if you have any questions
Thank You

$XMR looks really good!!Thats my long term view for Monero, I strongly believe that we are in the beginning of the next bullrun

Monero ($XMR) Attractive for Investors
XMR's correlation with Bitcoin's price is minimal, making its market behavior unique.
The coin is nearing resistance at $179-$187. Considering the growth since early September 2023 and the overall upward trend in the market, a continuation of XMR's rise is plausible. Beyond the current resistance, XMR could test the $200 and $210 levels. A firm hold above these levels might significantly boost its growth.
A correction for OMXSTO:XMR seems unlikely, with key support at $155-$162. The asset could only fall to this level if Bitcoin dips to $38,000. The $150 level and the $135-$143 zone are attractive for accumulating the coin in the spot market.

XMRUSDT ( don't panic ... )hello dear investor and traders
don't open sell position for some news
XMR The price is well supported on the supportzone …
long time ago: President Trump gave a reward for tracking Monero transactions... but Monero continues to work strongly and has the most secure blockchain…
don't panic : The mafia is waiting to get bigger to collect Monroe
good luck
