XMRUST trade ideas

XMR - SHORT SETUP!XMR short setup looking good on daily timeframe. We have clean downtrend forming (LL and LH). Price touching 200 EMA which has previously acted as a strong resistance. 200 EMA lines up with fibonacci levels + trendline 3rd touch. We can still see some bullish action from the CPI data but expecting it to be short lived. Send it to the goblin town.

XMR Idea: The price is again trying to break through the 200 EMA on the daily chart. The nearest support and resistance levels are indicated in case of breakout/rebound.


XMR short- as you can see the XMR formed a huge falling chanel at daily time frame but ..
- there are rising wedge formed inside - also divergence defined: CCI, MOM, MACD, RSI (source macd histogram)
- before breakout of falling chanel we maight see back movement to middle of the channel or lower (the 0.5 level of Fib is near 139)

#Monero Roars 30% from November Lows, XMR Bullish above $140Past Performance of Monero
The Monero climb to spot rates is encouraging. From the daily chart, XMR is up roughly 30 percent from November lows. The good news is that the losses of early November have almost been reversed. Therefore, although trading volumes are light and traders are hoping for even more gains, sellers are in a commanding position from a top-down analysis.
#Monero Technical Analysis
There are higher highs visible from the XMR price action in the daily chart. With a 30 percent spike from November floors and bulls redoubling their efforts to stem losses, there is more room for more gains. Even though XMR is bearish from volume analysis, traders' resilience is worth mentioning. Ideally, XMR must close above $160 for the new trend definition. Even so, at spot rates, XMR is solid as long as prices are above $140. Therefore, aggressive traders can be loading the dips, targeting $160. Meanwhile, with rising volumes, any spike above $160 could allow conservative traders to buy the dips in a breakout formation, setting their eyes at $175 or Q3 2022 highs.
What to Expect from #XMR?
Candlestick arrangement favors bears. Nonetheless, the rejection of lower lows over the past month qualifies buyers. As aforementioned, there is more room for gains if XMR holds above $140.
Resistance level to watch out for: $160
Support level to watch out for: $140
Disclaimer: Opinions expressed are not investment advice. Do your research.

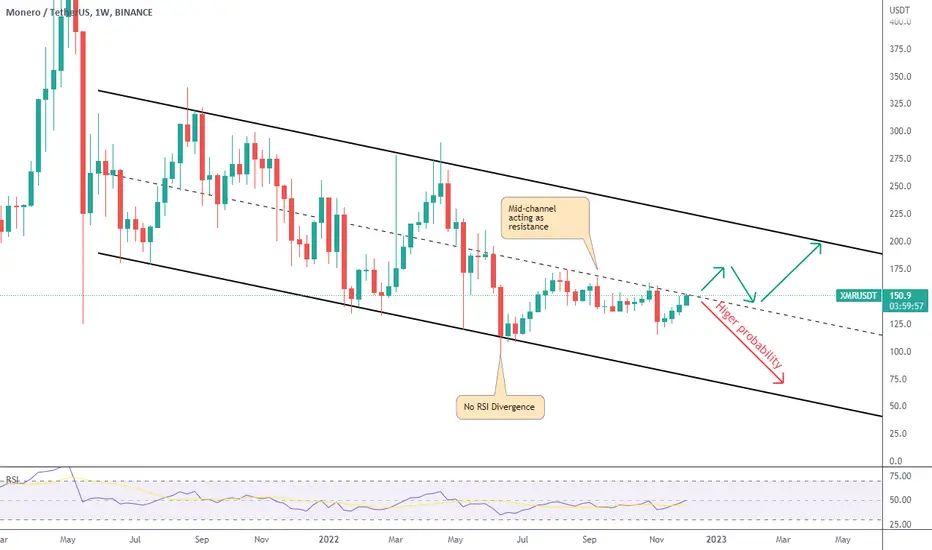
XMR - 18 month falling channelSince its massive drop in May 2021, Monero has been grinding downwards in a well defined channel.
My current bias is that we should still see at least one more leg down ("higher probability" scenario on the chart).
A break of the mid-channel line could give bulls hope for a test of the top of the channel.
For now, I´m looking for short trade opportunities.

XMRUSDT (4H) - Bullish breakoutHi Traders
XMRUSDT (4H Timeframe)
The market is in an uptrend, and we are waiting for an entry signal to go LONG above the 148.52 resistance level. Only the downward break of 141.20 would cancel the bullish scenario.
Trade details
Entry: 148.52
Stop loss: 141.20
Take profit 1: 153.04
Take profit 2: 160.35
Score: 7
Strategy: Bullish breakout

XMR: Approaching ResistanceTrade setup : Price rebounded from Support zone ($125-130) and reached stiff resistance area near $150 and also 200-day moving average. This is a critical level. Price is likely to get rejected here, but if it’s able to break through, it could revisit $175 thereafter.
Trend : Uptrend on Short-Term basis, Neutral on Medium-Term basis and Downtrend on Long-Term basis.
Momentum is Bullish (MACD Line is above MACD Signal Line and RSI is above 55).
Support and Resistance : Nearest Support Zone is $125-130, then $100. The nearest Resistance Zone is $150, then $175, and $200.

XMRUSDT | WATCHOUT LEVELXMRUSDT has been trading near the horizontal resistance.
The price has broken above the falling resistance.
The bulls need to break above the level.
We are expecting bulls will break above the resistance zone .
Manage your trades accordingly.


XMR DROP SOONI think xmr will move down soon. The supply zone is a good place to look for sell/short

MONERO POTENTIAL SHORT SETUPXMR has multiple rejections of the 20 EMA in the weekly, as well as 4 rejections of the 200 MA in the daily. In addition, it is currently facing a downwards Trendline.
RR of the trade is 3.07.

XMRXMR/USDT/PERPETUAL/1H
The price chart is in a short-term ascending channel, due to the breaking of the RSI trend line, there is a possibility of a downward trend. Commented:
$145
$142.6
$139

XmrusdLooking gorgeous here tbh
Htf downtrendline break and following through w a green candle
Massive falling wedge structure
Still the best privacy coin as far as i know

Standing Firm on the Monero Hourly Cup With HandleI'm yet to be convinced that the Monero Cup with Handle has been invalidated as it would seem a small Gartley and some Hidden Bullish Divergence has formed at these highs and may allow XMR to hold the channel. As a result i will be doubling my position but tightening the stop with the same profit target as before and an end of week goal.

XMR Key PointWatch XMR as it approaches the previous upper candle wick and the MA200. Lots of possibilities, though a rejection is the safest bet. Tight stop loss right above MA200.

XMRUSDT | LONG ON BREAKOUTMONERO has been trading with in a rising wedge from last 3 weeks.
The price has now broken above the wedge
The price is currently trading near the falling horizontal resistance.
The bulls need to break above the horizontal resistance to get complete control.
Manage your trades accordingly.

XMRUSDT Elliott Waves AnalysisHello friends.
Please support my work by clicking the LIKE button👍(If you liked). Also i will appreciate for ur activity. Thank you!
Everything on the chart. (update)
Entry: market and lower
Target: 165 - 195 - 230
Main target zone: 220 - 250
after first target reached move ur stop to breakeven
Stop: ~99 (depending of ur risk). ALWAYS follow ur RM .
Risk/Reward: 1 to 3.5
risk is justified
Good luck everyone!
Follow me on TRADINGView, if you don't want to miss my next analysis or signals.
It's not financial advice.
Dont Forget, always make your own research before to trade my ideas!
Open to any questions and suggestions.

XMRUSDT | SETUPXMRUSDT has been trading in a channel.
The price has continuously getting rejection from upper boundary of channel.
The price is now approaching to the resistance zone.
Manage your trades accordingly.

🔥 XMR: Waiting For The Perfect TradeOver the course of 1.5 years, XMR has been trading bearish inside this well-defined bearish channel. All touches on the top resistance have been sold, all touches on the bottom support have been bought.
There's little volatility in XMR ever since the bottom of June 18th (6 months ago), so there's little reason to scout for longer-term entries.
I'm currently in a mode of patience. Set alarms for when the price hits either the resistance or support and wait for the alarm to hit. By then we can decide whether it's a good time to enter or not.
Targets are the middle two dotted trend lines.

XMRUSDT wants the 4h Demand Zone?
The price is testing the dynamic resistance on 0.382 Fibonacci level after the breakout from the dynamic daily resistance
How to approach it?
IF the price is going to grab new liquidity and create a new bearish impulse, According to Plancton's strategy , we can set a nice order
–––––
Keep in mind.
🟣 Purple structure -> Monthly structure.
🔴 Red structure -> Weekly structure.
🔵 Blue structure -> Daily structure.
🟡 Yellow structure -> 4h structure.
⚫️ black structure -> <= 1h structure.
–––––
Follow the Shrimp 🦐
