Natural Gas (XNG/USD)Overall Bias: Bearish with potential for a short-term bounce
Key Observations:
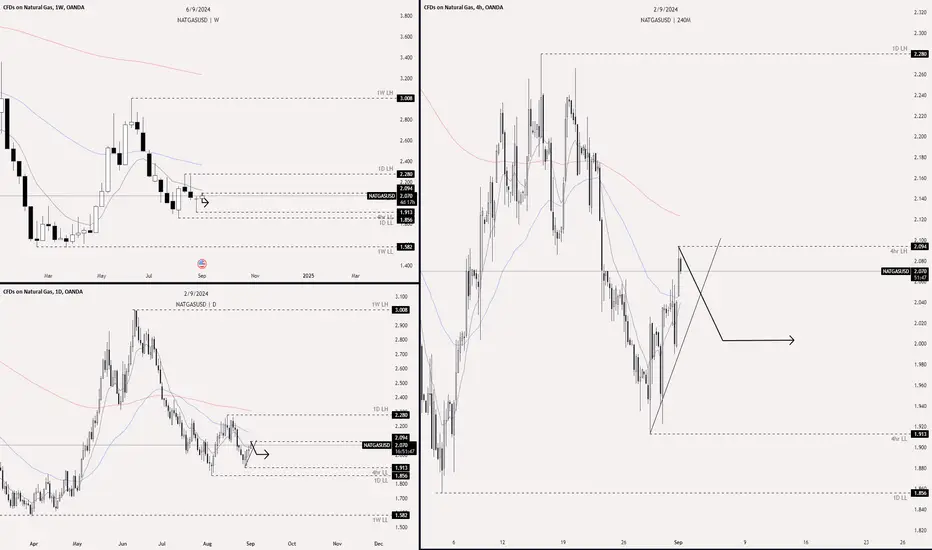
1. 1-Month Chart:
• Price Action: The long-term bearish trend is still intact. The price peaked at $9.177 and has since declined to the current level near $2.066.
• Support Levels: Major support is around $1.59. A break below could lead to a further drop.
• Resistance Levels: The resistance at $4.641 is a significant level that will likely cap any upside in the medium term.
• ATR (Volatility): With an ATR of 2.000, we can expect sharp price movements.
2. 1-Week Chart:
• Price Action: Natural Gas has broken below key support levels. The most recent candle shows price stabilizing near $2.066 after a significant drop.
• Support Levels: $1.60 is key weekly support.
• Resistance Levels: Significant resistance is around $4.641 (Fibonacci 0.236 level). The next resistance lies at $3.722 (Fibonacci 0.382).
• RSI: At 30.93, the RSI indicates that the market is near oversold territory, hinting at a potential bounce.
• MACD: Weekly MACD remains bearish, indicating downside momentum.
3. 1-Day Chart:
• Price Action: The price has tested a low of $1.591 and bounced back to $2.066. The price is currently trading below significant moving averages, showing weakness.
• Support Levels: Immediate support is $1.55. Below this level, there is not much support until $1.460.
• Resistance Levels: $2.639 (0.236 Fibonacci) is key resistance on the daily chart. Above this, $3.00 would be a psychological level.
• RSI: RSI at 39.41 is nearing oversold territory, indicating the possibility of a bounce.
• MACD: The daily MACD is bearish, though the histogram suggests the selling pressure might be easing.
4. 4-Hour Chart:
• Price Action: The 4-hour chart shows Natural Gas has formed a bottom near $1.55 and is now attempting to bounce. However, the price is still in a lower high/lower low structure.
• Support Levels: Immediate support is $1.555, which aligns with previous lows.
• Resistance Levels: The short-term target is $2.639, a key Fibonacci retracement level.
• RSI: At 48.60, the RSI is neutral, showing that Natural Gas has some room for upside before becoming overbought.
• MACD: The MACD has slightly turned bullish on the 4-hour chart, suggesting that there could be some short-term upward momentum.
5. 1-Hour Chart:
• Price Action: The price is currently consolidating between $2.066 and $1.555. The 1-hour chart is showing early signs of a potential bullish reversal.
• Support Levels: Strong support is at $1.555. If the price breaks below this, it could test the lows near $1.460.
• Resistance Levels: Immediate resistance is $2.27. A break above this level could lead to a retest of the $3.00 psychological level.
• RSI: The RSI at 57.09 is approaching neutral-to-overbought levels.
• MACD: The MACD is neutral but shows slight bullish divergence, supporting the case for a short-term bounce.
6. 30-Minute Chart:
• Price Action: The price is showing signs of bottoming in the short term and could head towards $2.27 (recent high) before retesting support.
• Support Levels: Immediate support is $1.555, while $1.863 could act as a mid-term support level.
• Resistance Levels: If the price can break above $2.27, a retest of $2.66 is likely.
• RSI: At 62.96, the RSI is nearing overbought conditions, which could suggest a minor pullback or consolidation before a further upward move.
• MACD: The MACD on the 30-minute chart has turned bullish, supporting short-term upward movement.
Trading Strategy:
Primary Bias: Bearish
• Short Position:
• Entry: Consider shorting near $2.27 (Fibonacci 0.764 level) if price shows resistance.
• Stop-Loss: Place a stop-loss above $2.66 (key resistance).
• Take-Profit Levels:
• First target: $1.863 (recent low support).
• Second target: $1.555 (strong support level).
Alternative Scenario: Short-term bounce
• Long Position (Speculative):
• Entry: If the price bounces from $2.066, consider a long position targeting the next resistance levels.
• Stop-Loss: Below $1.555 to limit downside risk.
• Take-Profit Levels:
• First target: $2.639 (0.236 Fibonacci).
• Second target: $3.00.
Risk Management:
• Position Sizing: Due to high volatility (ATR of 2.00), keep position sizes smaller than normal to manage risk.
• Stop-Loss: Ensure stop-losses are placed carefully, especially near support/resistance levels to avoid being stopped out by volatility.
Conclusion:
Natural Gas is currently trading near significant support levels, but the overall trend remains bearish. A short-term bounce could occur, especially if the price holds above $2.066, but the bearish momentum suggests the longer-term outlook remains to the downside. Any upside is likely to face resistance at $2.66 and $3.00. For now, shorting near resistance zones around $2.27 could be the favorable trade, while taking advantage of a potential bounce for short-term gains is also viable for more aggressive traders.
XNGUSD trade ideas

Natural Gas: Bearish OutlookNatural Gas: Bearish Outlook
Technical Analysis:
The price of natural gas recently completed a “Rising Wedge Pattern” near the 2.2960 level, increasing the likelihood of a bearish wave.
The geopolitical situation remains highly unstable, causing frequent price fluctuations.
In the past few hours, the price has dropped by approximately 3.35%, and it is expected to decline further to the 2.1760 and 2.100 levels.
You may find more details in the chart!
Thank you and Good Luck!
❤️PS: Please support with a like or comment if you find this analysis useful for your trading day❤️

Natural Gas waking up? Nat gas showed some poise today.
Holding green in a red market where most commodities saw negative price action.
This is impressive to see because Nat gas has a long historical trend of diverging from many commodities.
The price action today also saw a red to green reversal further emphasizing the positive potential trend shift.
Nat gas stocks were discounted today despite the stronger price action in the commodity.
We remain bullish and long UNG, our call positions in the money.

Waiting for NaturalGas to rise. H4 30.08.2024Waiting for NaturalGas to rise
Gas tried to break down to 2.00 twice and bought back twice.
And large volumes are now around 2.10 and defending.
If they are not pushed down, they may rise to the upper boundary of the flat to 2.30 and even 2.50.
Increased vertical volumes came in at the moments of buyback, which often coincides
with the culmination and turns the market.

NATGAS - NEW BEARISH MOVEHi Traders !
Previously, The NATGAS formed a head and shoulders pattern.
The NATGAS reached the neckline and failed to break it,
At the moment, The last higher low is broken !
So, I predict a new bearish move📉
_____________
TARGET: 1.974🎯

XNG/USD "NATURAL GAS" Robbery plan in Long SideHola ola My Dear,
Robbers / Money Makers & Losers,
This is our master plan to Heist XNG/USD "NATURAL GAS" Mines based on Thief Trading style Technical Analysis.. kindly please follow the plan I have mentioned in the chart focus on Long entry. Our target is Red Zone that is High risk Dangerous level, market is overbought / Consolidation / Trend Reversal at the level Bearish Robbers / Traders gain the strength. Be safe and be careful and Be rich.
Note: If you've got a lot of money you can get out right away otherwise you can join with a swing trade robbers and continue the heist plan, Use Trailing SL to protect our money.
Entry : Can be taken Anywhere, What I suggest you to Place Buy Limit Orders in 15mins Timeframe Recent / Nearest Swing Low
Stop Loss : Recent Swing Low using 2h timeframe
Warning : Fundamental Analysis comes against our robbery plan. our plan will be ruined smash the Stop Loss. Don't Enter the market at the news update.
Loot and escape on the target 🎯 Swing Traders Plz Book the partial sum of money and wait for next breakout of dynamic level / Order block, Once it is cleared we can continue our heist plan to next new target.
Support our Robbery plan we can easily make money & take money 💰💵 Follow, Like & Share with your friends and Lovers. Make our Robbery Team Very Strong Join Ur hands with US. Loot Everything in this market everyday make money easily with Thief Trading Style.

NATGAS Outlook💹 Commodities:
📉 Bearish Outlook:
NATGAS has been breaking into new lows on our Weekly, Daily, and 4hr time frame.
Context time frame (1W): Price has been surfing below the 10ema and is showing strength.
Context time frame (1W): Price has brokeup into the 10ema and has showed a valid pullback.
Validation time frame (1D): Price is showing strength and surfing below the 10/50/200 EMAs.
Validation time frame (1D): Price has brokeup into the 10ema/50ema and has showed a valid pullback.
Entry time frame (4hr): Price has brokedown the 10ema/50ema and has showed a valid pullback.
Entry time frame (4hr): I'm interested in shorts if price can get below the 10ema and start showing strength.
Keeping an eye on this. 👁️
NATURAL GAS LONG IDEAhi everyone here is my long setup for natural gas.
entry : 2.204
stop : 2.1641
target : 2.3485

Natural Gas (NATGASUSD):: Bullish Outlook ExplainedI spotted two strong bullish indicators on the 4-hour chart for 📈NATGASUSD. These include a bullish breakout of a double bottom pattern's neckline, which was acting as a horizontal resistance, as well as a break of a falling trend line.
The broken structures now form an expanding demand zone, suggesting a potential bullish movement in the market. I believe there is a high likelihood that the pair will continue to grow and reach the 2.10 level.


Nat gas reversalWe are forming an inverted head and shoulders on the low time frames right now (upto the daily), we also have a bigger one on the weekly forming. A 4h close above 2.280 (OANDA) will see the smaller timeframe confirmed, for the weekly a close above 3.350

Natural Gas may be at the start of a big move higherNatural gas has had a small move higher recently and has now pulled back to the 61.8% fib. This area is often a key price point where the market could start a major move higher. We could see a big trend starting from anywhere around here.
Even though we have the trend structure in place we will need to see buyers steps in and a trigger to buy signal. All we can do now is wait for the green trigger buy signal. Stop placement will be below the last swing low with an open profit target. However, if we do see buyers stepping in then 3200 would be an obvious target. Further up side from there is possible.
This could be big trade so all eyes on this market.

US GAS (Long)Turtle soup Trading Strategy
The Turtle Soup strategy, however, flips the script, aiming to profit when those anticipated trend.Linda Raschke’s Turtle Soup strategy is a counter-trend trading approach that capitalizes on failed breakouts.
It takes inspiration from the famous Turtles trading experiment, where novices were trained on a trend-following system.

Natural Gas Short Term Sell IdeaH4 - Bearish divergence
Most recent uptrend line breakout
H1 - Bearish trend pattern followed by a pullback
Until the two strong resistance zones hold my short term view remains bearish here.

Natural Gas: The Bearish Movement Remains IntactNatural Gas: The Bearish Movement Remains Intact
From our previous analysis, the price confirmed a double top pattern and moved down as expected.
Although the pattern was somewhat complex, it performed well.
Today, the pattern is once again confirmed, indicating that natural gas may continue to move down if it holds below $2.13
📺You may watch the video for further details📺
Thank you and Good Luck!

XNG/USD: Natural Gas Price Hits 2.5-Week LowXNG/USD: Natural Gas Price Hits 2.5-Week Low
As shown on the XNG/USD chart, today, the price of natural gas fell below $2.16 for the first time since 8 August.
Bearish sentiment is being driven by the fact that: → This is the last week of summer. Gas consumption typically decreases in mid-September as the use of air conditioning declines; → Gas storage levels are abundant. According to Reuters, current stock levels exceed the seasonal average by 12%.
A technical analysis of the XNG/USD chart provides several arguments suggesting that bears hold the upper hand in the market:
→ Price action is forming a descending channel, shown in red. The upper boundary of the channel acted as resistance, with the price forming a bearish rounding reversal pattern (as indicated in blue).
→ After a large bearish candle on 22 August, the resistance level at $2.24 became more significant.
→ Support lines, forming a fan shape, are being broken one by one, with increasingly shallow angles indicating weakening demand.
Nevertheless, bulls have an opportunity to turn the situation around by using support from the trendline (shown in yellow) at least in the short term.
However, in the longer term, if the supply-demand balance remains unchanged, there is reason to believe that the price of natural gas on the XNG/USD chart may continue its downward trend within the red channel.
This article represents the opinion of the Companies operating under the FXOpen brand only. It is not to be construed as an offer, solicitation, or recommendation with respect to products and services provided by the Companies operating under the FXOpen brand, nor is it to be considered financial advice.

NATGAS - Head and Shoulders Hello Traders !
On Monday 12 August, The NATGAS reached the resistance level (2.213 - 2.250) and failed to break it !
The price formed a head and shoulders pattern.
Currently, The neckline is broken !
So, I expect a bearish move 📉
____________
TARGET: 1.974🎯

XNGUSD(Long)Turtle soup Trading Strategy
The Turtle Soup strategy, however, flips the script, aiming to profit when those anticipated trend.Linda Raschke’s Turtle Soup strategy is a counter-trend trading approach that capitalizes on failed breakouts.
It takes inspiration from the famous Turtles trading experiment, where novices were trained on a trend-following system.

NATGAS WILL GO UP|LONG|
✅After the retest of the of horizontal support of 1.90$
It makes sense to expect a bullish correction
Aa the NATGAS is oversold and the market players
Will be taking profit from the level
Fuelling a buying wave
LONG🚀
✅Like and subscribe to never miss a new idea!✅

EWTSU NATGAS H4 micro ((5)) going to end
EWTSU
NATGAS H4 micro ((5)) going to end in a zigzag subminuette abc
invalidation 2084 wave a of abc

US GAS (Short) Turtle soup Trading Strategy
The Turtle Soup strategy, however, flips the script, aiming to profit when those anticipated trend.Linda Raschke’s Turtle Soup strategy is a counter-trend trading approach that capitalizes on failed breakouts.
It takes inspiration from the famous Turtles trading experiment, where novices were trained on a trend-following system.

Natural Gas King #2Hello Ladies and Gentlemen,
Natural Gas is approaching its lowest price since its inception!
Who knows who Arnold is?

Natural Gas Robbery Plan To Make and take MoneyMy Dear Robbers / Traders,
This is our master plan to Heist Natural gas based on Thief Trading style Technical Analysis.. kindly please follow the plan I have mentioned in the chart focus on Short entry. Our target is Green Zone that is High risk Dangerous level, market is oversold / Consolidation / Trend Reversal at the level Bullish Robbers / Traders gain the strength. Be safe and be careful and Be rich.
Note: If you've got a lot of money you can get out right away otherwise you can join with a swing trade robbers and continue the heist plan, Use Trailing SL to protect our money.
Stop Loss : Recent Swing High using 1h timeframe
Warning : Fundamental Analysis comes against our robbery plan. our plan will be ruined smash the Stop Loss. Don't Enter the market at the news update.
Loot and escape on the target 🎯 Swing Traders Plz Book the partial sum of money and wait for next breakout of dynamic level / Order block, Once it is cleared we can continue our heist plan to next new target.
Support our Robbery plan we can easily make money & take money 💰💵 Follow, Like & Share with your friends and Lovers. Make our Robbery Team Very Strong Join Ur hands with US. Loot Everything in this market everyday make money easily with Thief Trading Style.
