XPDUSD forecast for 2022Palladium is so far the biggest looser since the COVID, all of the relevant factors kept it from recovery due to the lower demand in automotive industry which made palladium popular in first place. Considering the inflation and very uncertain demand I think palladium will once again test it's lowest support and then skyrocket towards $ 3K.
XPDUSD trade ideas

PALLADIUM- Updated chart (Price at resistance)XPD/USD bears aim for 50-DMA during four-day downtrend
NEWS | 1/3/2022 5:34:27 AM GMT | By Anil Panchal
Share on Twitter Share on Facebook Share on Linkedin
Palladium stays pressured around intraday low, keeps pullback from five-month-old resistance line.
50-DMA, 23.6% Fibonacci retracement level limits immediate downside.
11-week-old horizontal line adds to the upside filters.
RSI retreat, failures to cross immediate hurdle signal for the downside.
Palladium (XPD/USD) fades bounce off intraday low, down 0.12% on a day around $1,919 during early Monday.
The precious metal rose to the highest since November 22 before stepping back from a five-month-long descending resistance line during the last week.
The pullback moves do gain support from the RSI retreat, which in turn directs the sellers towards a convergence of 50-DMA and 23.6% Fibonacci retracement of May-December south-run, near $1,885.
It’s worth noting that September’s low surrounding $1,849 may offer an intermediate halt during the quote’s downside past $1,885 before the bears can aim for the $1,800 threshold.
Meanwhile, recovery moves need to cross the stated resistance line, around $1,965 at the latest, to recall the buyers.
Even so, the $2,000 psychological magnet and tops marked during October-November, near $2,180, will be tough resistances to cross for the XPD/USD bulls before retaking the controls.
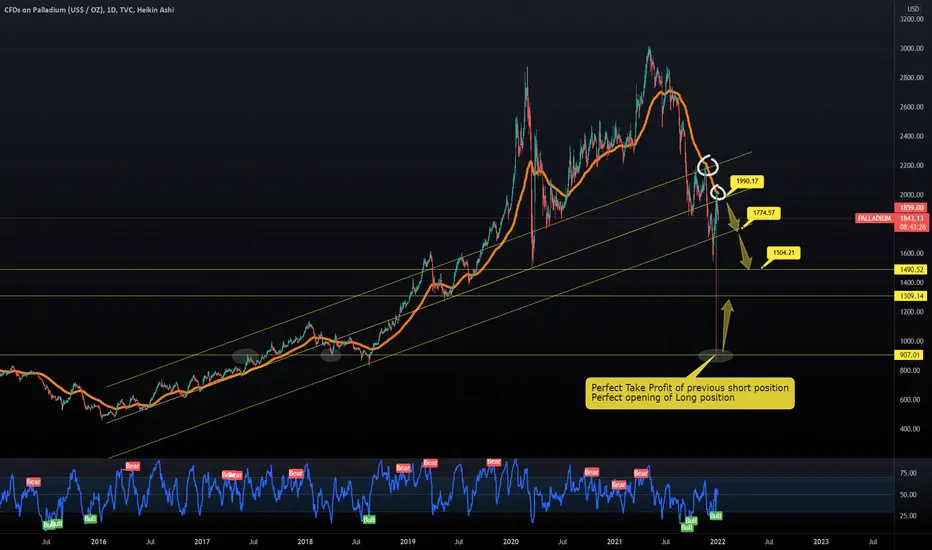
Our chart worked really well again. Take a look:
One Love,
the FXPROFESSOR
XPDNot financial advice.
The essence of investing & trading is the intelligent and patient preying on the greed, fear, impatience, addiction and ignorance of the majority. It's definitionally Darwinian.

At the end of the correction? It is quite possible that 2022 will be a special year for precious metals. But here first on a short distance, how the course could result.

Pall GeotimeWe have approx 10 year cycles
It's been in a bubble due to dieselgate etc
Green hydrogen is being set up around platinum
This will lose ground to platinum
It's a short in four figs for me
NOT TRADING ADVICE

Has Palladium Made A Bottom?This is unclear of yet but it's looking quite likely that a bottom may be in, Have spotted a few confluences to add more confirmation - time will tell.

PALLADIUMPalladium chart is a train wreck
I would be very surprised if it doesn't visit the corona lows
And even with a significant bounce it's likely to be in a bear market for sometime
NOT INVESTMENT ADVICE
Note- action-reaction chart in log
Also- smacks of a slowdown/demand-side problems in 2022

Palladium buy rangeSell now, buy later. Long range is 1400-1600. Palladium is still in correction. 22-23 sell range is 2800+.

Palladium Is Longing for RecoveryPalladium futures are falling for the eighth consecutive month from their peaks at $3019 per ounce in April-May this year. And there are a number of reasons for such a decline as palladium is used as an industrial metal for the production of car components that are used in high-ecological standard engines. However, the car production industry is suffering due to lagging demand and supply chain disruptions.
The other reason is persisting expectations about the faster tapering of the bond purchasing programs and interest rates hike by the Federal Reserve (Fed). The Omicron variant could also be considered as a bit of a worry amid fears of possible lockdowns and further drops in demand. Due to all these reasons, palladium plunged 44% from its May peak and continued on its downward spiral until mid-December, where its futures are traded around $1670 per ounce.
But nothing is over for palladium at the moment. If you look at the weekly or monthly chart of its price, you may find a “rising wedge” pattern that continues implementing itself and point to the $1360-1380 per ounce zone. So, we may consider buying operations only once the price will be near that level. Moreover, the minimums of March 2020 also point to this zone. Prices have been declining for a long time up until now and the asset is longing for an upside correction. The prices of futures may return to $2200 per ounce alongside the correction. However, any long-term bets would be certainly premature as the future green development of the global economy and car industry, in particular, is clouded. For a more accurate analysis, the pace of hybrid and electric vehicle construction should be considered.
According to Citigroup palladium prices may rise significantly along with the recovery in demand. The shortage of palladium is inevitable as the car industry recovers. But this forecast is likely to be moved further in time closer to 2023.

Fibonacci and clouds - the dream duoOne of my jobs as a technical analyst was to provide trading ideas. Sometimes this was intraday and sometimes these were longer term strategic positions.
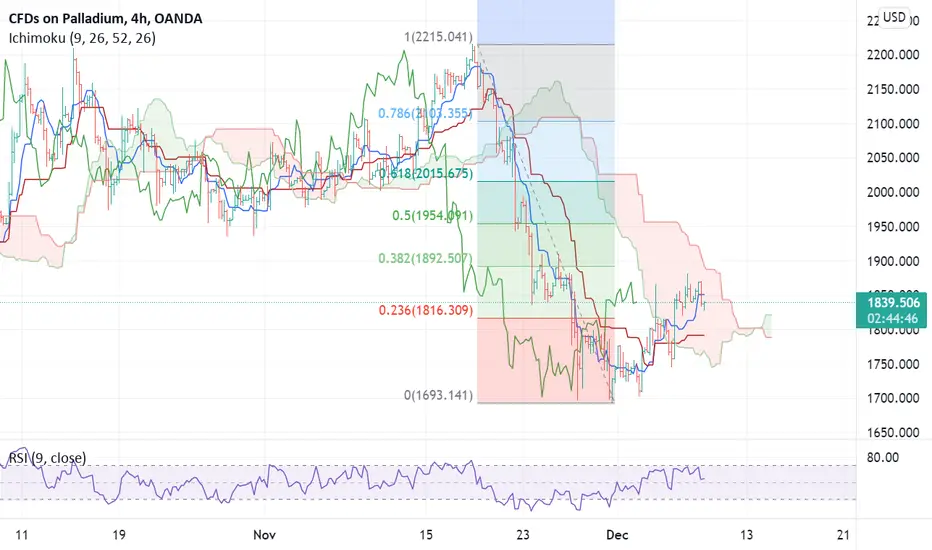
When it comes to intraday entry points I like to use a couple of indicators at least to give me a potential entry point and for me, my dream duo is the Fibonacci retracement and the ichimoku cloud combo. I particularly like to use this on the one hour and 4 hourly chart.
The above 4 hourly chart on palladium is showing that the corrective move higher is about to run into the top of the cloud and the 38.2% retracement of the recent sell off at 1892. The combination of the two should act as decent resistance and we will be looking for signs of failure here.
Disclaimer:
The information posted on Trading View is for informative purposes and is not intended to constitute advice in any form, including but not limited to investment, accounting, tax, legal or regulatory advice. The information therefore has no regard to the specific investment objectives, financial situation or particular needs of any specific recipient. Opinions expressed are our current opinions as of the date appearing on Trading View only. All illustrations, forecasts or hypothetical data are for illustrative purposes only. The Society of Technical Analysts Ltd does not make representation that the information provided is appropriate for use in all jurisdictions or by all Investors or other potential Investors. Parties are therefore responsible for compliance with applicable local laws and regulations. The Society of Technical Analysts will not be held liable for any loss or damage resulting directly or indirectly from the use of any information on this site.

Palladium , some move up soon I am seeing this to retest the wave 4, from there we will see if it gonna be corrective or impulsive down

PalladiumTerribly bearish
Two targets one is that demand zone around 1500
But really that 1.618 zone looks juicy
Platinum is so much cheaper and having the green hydrogen industry set up around it
DISCLAIMER: Nothing here constitutes advice

Long term palladium buy opportunity We can potentially see an additional 10% drop but we’ll be buying at every bit of the dip. I believe this is a 1 in 5 year buying opportunity for palladium. Currently the recent Covid variant news is putting downwards pressure on this precious metal as its main driver of demand is through vehicle manufacturing but the suppression of price won’t happen for too much longer. Long term strategy play, a potential to test prior all time high within the next year. Let’s wait and see…enjoy the ride. ✌️


Good Buying opportunity In PalladiumPalladium trading at the bottom where the previous bull run started and is above the fib level of 0.23 which also the good support zone on daily TF.
1810 1821 and 1832 are the levels to watch any dip at those levels could be a good buying levels

Thanksgiving Is a Time to Talk About PalladiumYesterday was Thanksgiving in the USA, so the American session was very passive, and there was no particular news. Is that a local panic in connection with a new strain of coronavirus from South Africa.
Let's take advantage of this pause in the information flow and talk about palladium. Why about him and why now?
Bloomberg Commodity Index continues to grow and update the highest levels in many years. But palladium has lost 40% of its value over the past few months. Which in itself is of interest. And now we are talking about palladium because its prices have approached the key support level, and the automotive giants have reported on the results of the third quarter and we can already draw some conclusions.
Let's start by answering the question why palladium fell? In short, a shortage of chips has caused problems for car manufacturers. Extremely typical in 2021 was news such as Ford suspended the work of such and such a factory, Toyota closed such and such a factory for so many weeks, etc.
Since 84% of the global demand for palladium is generated by automakers, the decline in palladium prices looks logical. But as usual, the medal has more than one side.
Palladium has been and remains one of the most scarce precious metals in the world. According to Metals Focus, the palladium deficit in 2021 with a market volume of 10 million ounces per year could reach 1 million ounces per year. Note that the palladium market has not come out of the deficit for 5 years in a row. And it's hard to imagine a better reason for a rise in prices on the physical asset market than a deficit (ask oil after OPEC + cut production by 10 million b / d).
Will 2021 be a watershed year due to chip shortages? Judging by the current statistics on car production in the world, definitely not. Yes, the production level of 2019 has not yet been reached, but the volumes of 2020 have already been exceeded by a third (and 2020, even with a sharp decline in car production, was a year in short supply for palladium). But in addition to the quantitative aspect, there is also a qualitative one - the tightening of emission standards leads to an increase in demand for raw materials for catalysts (palladium).
The palladium supply is also not going well. The two key palladium producers in the world - Russia and South Africa - are in trouble in 2021. Russia - due to the accident at the mines of Norilsk Nickel (the largest palladium producer in the world with a share of under 40% of world production), and South Africa in recent years has basically reduced production.
Total: there is a feeling that the markets have overdid it with minus 40%. It's not that bad, and on the contrary, current palladium prices look very promising. So we recommend that you pay attention to the purchase of this metal.

Palladium Update. it acted exactly according to the analysisAs I mentioned in our previous analysis, we considered the price correction to the specified levels to be possible, which happened now that we are trading at the end of the week. . And we predict growth up to specified prices. Also, the well-formed M model has been completed and we will be deciding to start a bullish price rally in the coming days .Otherwise the current level breaks and further correction to specified levels is less likely ....

Formation of twin roof pattern and price correctionForm a twin roof pattern and modify it to the points specified in the diagram

PalladiumGood morning starts with a good trade, wolves🔥
One more formation. So get ready
The price multiple times bounced from support and resistance level.
Possible retest of the level is expected.
Follow the chart and look for the best price to enter carefully.
_____________________________________________________
If you enjoy my FREE Technical Analysis , support the idea with a big LIKE👍 and don't forget to SUBSCRIBE my channel, you won't miss anything!
Feel free to leave comments✉️
And always remember: "we don't predict, we react".

PALLADIUM AnalysisAn idea suggesting bull continuation for palladium
Price can be seen to be sitting right on 4.618 of a trend that was drawn within the bull structure
This is a possible recovery point
It also aligns nicely when a trendline is drawn across the top of the two circles, providing a possible target
The green lines are strong support areas if the bull idea does not come to fruition

I'm a bit new please be nice Hi can one take a look at the posted idea and let me know what your views/what you think.
Can anyone give any advice on how you can improve on this (I am pretty new to this please be nice).
Very simple stuff but Palladium appears to be in a side trend so thinking place a pending buy or sell order just past the channels/trend lines (taking of the order which doesn't get trigged) and using a 2 ATR stop loss.

Two possible ways to the palladium goThe chances of it going up is bigger than going down, not sure how much, but I would say 70% to go up
