XPDUSD trade ideas

PALLADIUM Will most likely form WedgeWedge structure in the making
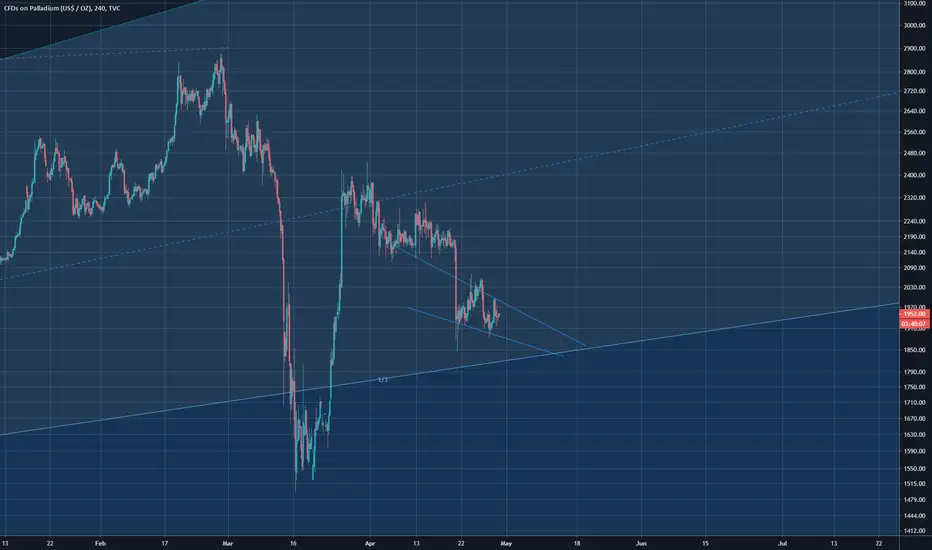
Looks good for buy along the Gann line
Palladium distribution zone shortTVC:PALLADIUM
#Palladium is making a distribution pattern on daily. Let's see if this trade is possible.

Long XPDUSDFirst we can see a broken symetric traingle with the retest and a Supply zone, when the price arrive to the other zone we have to wait the price action to go to Shorts.

Bubble collapse pattern plays outAs shown in the previous idea below, palladium has enetered a multi year bear market in suit with almost all other securities and equities. Beware longs.
Current bear targets at 1200 and 800$.

PALLADIUM 1D DESCENDING TRIANGLEDescending Triangles are repeatable trading chart patterns.
Descending chart patterns will have a directional bias depending on the previous incoming trend.
Each chart pattern will have defining trendlines of the support/resistance levels creating the pattern.
Whatever time frame you are trading this chart pattern, wait for a candle close outside of the trendline in the direction of the breakout candle. (Our time frame preference is the Daily chart).
Add volume indicator - Volume is the amount of $ that went into a particular candle or in Forex the # of trades that took place.
Add ATR indicator - Volatility is the amount of price movement that occurred. Use the ATR to measure the price movement.
When you see descending Volume bars and descending ATR line (which indicates volatility) this shows
a dis-interest in traders to invest in this pair creating consolidation which creates the chart pattern.
Trade Management after there is a breakout candle close.
1 - Position size (compare volume bar to volume ma line).
a - Breakout candle must be 100% of the average volume for a full position size.
b - If 75% of average volume then ½ position size. (To find 75% of Volume
look at the charts volume settings – divide smaller # into larger # = 75%+)
2 - Enter two trades.
3 - SL for both trades will be 1.5 x ATR.
4 - 1st trade TP will be 1 x ATR.
5 - No TP on 2nd trade – letting profit run and adjusting SL to follow price.
6 - When 1st TP hit – move 2nd trade SL to breakeven.
7 - Adjust the 2nd trade SL to follow price.
*8 – After Breakout candle – if price closes back into chart pattern close trade
*9 - When breakout candle is more than 1 ATR from breakout candle open.
a - Enter 1st trade at candle close with ½ position size.
b - Enter 2nd trade with a pending limit order that is 1 ATR of breakout candle open.
c – Price should pullback to that pending limit order for 2nd trade.
d – If Price returns back into chart pattern close trade before SL is hit.

3-DIMENSIONAL ANALYSIS CONTINUATION 3We will continue from the last post.
Putting it all together, I would like to remind us that
The diagonal of a square = 1.4142 x the value of the side
The diagonal also represents the next energy level or the side of the next square in
the growth spiral.
In 2-dimensional view, the next Vector value is measured from the midpoint of the previous diagonal or energy level.
Please check the snapshot for the description
Also, the area of a triangle = 1/2 x Base x Height
By Pythagoras, Hypotenuse² = Base² + Height²
Now, the first Cycle ABC completed in 1072 days
If we square out 1072 by 1072 sides the diagonal will be = 1072 x 1.4142
1072 x 1.4142 = 1516 units
That means the side for our next square which is also the diagonal of the lower energy
square is equal to 1516 units for time and 1516 units for price
Point E was 1560 days and point F completed in 1507 days
Next square is 1516 by 1516
Diagonal = 1516 x 1.4142 = 2144 units
To measure the price level for this units, we measure from the price midpoint of the
original square 1072 by 1072
1072 / 2 = 536
536 + 158 = 694
The original square has bottom at 158 and top at 1233. The midpoint from 158 to 1233
is 694 price level.
If we measure 2144 points from the midpoint = 694 + 2144 = 2838
This is exactly the level where price made a high on 27th February and that is the top of the
complete growth process
1072 x 2 = 2144
To further show that the first growth process was completed
Area of triangle = 1/2 x Base x Height
For triangle ABC, Base BC = 394 units. 394/2 = 197
By Pythagoras, Height = root( 1140² - 197²) = 1122.85
Then Area ABC = 1/2 x 394 x 1122.85 = 221201.45 units
For triangle DEF, Base DE = 663, 663/2 = 331.5
Height = root(2839² - 331.5²) = 2819.57
Area DEF = 1/2 x 663 x 2819.57 = 934690.62 units
From observation its clear that area DEF is 4.236 times the size of area ABC
221201.45 x 4.236 = 937009.34 units
4.236 ratio expansion shows completed growth.
The correction FG is 0.618 retracement of the 2144 square
2144 x 0.618 = 1324.992
High, 2838 - 1324.992 = 1513 (Price made a low at 1496)
Now this are the critical points to consider,
We may recall from the previous analysis where the 3rd base FG was 1386 units and we calculated its sides to be 5740 units
Notice the order of expansion in the Palladium structure
Base 1 = BC = 394
Base 2 = DE = 663 (394 x 1.667 )
Base 3 = FG = 1386 ( 663 x 2.09)
so the order here is 1 - 1.667 - 2
For the sides
AC = 1140 (1st square of 12)
EF = 2839 (this is the face-value same as 288 or 2nd square of 12)
GH = calculated to be 5740 ( 288 + 288 = 576, the face-value for 3rd square of 12)
so the order here is then, 144 - 288 - 576
Though the sides for the 3rd triangle are yet to form, the base has given a clue as to
the magnitude of the vector to expect.
Since the vector is a function of price and time, it means that if time stretches then
price will have a small margin to move, otherwise we will have a bull run over a
short period of time. The clue for time range is 2144 - 1507 = 637 days
Currently we took our trade at 1550 price level and expecting a double top and then
higher towards 3650 level if we break the current high.
At the current price level, the price may move further down to correct 0.618 retracement
of the recent swing high. Best entry for new trades is to wait for the retracement to
complete for a reduced risk of margin.
If you have any further questions for clarifications just post it in the comments and
will be explained in detail. Any additions and contributions are also highly welcome


3-DIMENSIONAL ANALYSIS CONTINUATIONPlease ignore the first 2 posts that the values in the root brackets were missing.
Sorry for the multiple posts.
We will continue from the last post, we already established the vectors for triangle DEF
in the previous analysis as
Cycle DEF:
Vector DE = root(498² + 438.32²) = 663 units
DE is the base of triangle DEF and is 1.667 expansion of the first base BC
394 x 1.667 = 657 units (short of 6 units)
Vector DF = root(1968² + 2005²) = 2809 units
Vector EF = root(1507² + 2405.94²) = 2839 units
DF and EF are also two sides of equal length and the base length DE as 663 units.
Vector FG is the correction after the completion of the 2nd growth and also forms
the base for the next triangle
FG = root(1385.69² + 18²) = 1385.81 units
Now we can see that the 3 triangle bases show successive growth
Base 1 = BC = 394 units
Base 2 = DE = 663 units (394 x 1.667 = 657, that is 1.667 expansion of BC)
Base 3 = FG = 1386 units (663 x 2.09 = 1386, that is also 2.0 expansion of DE)
Also the ratio of base to side for each successive triangle shows a growth pattern
For triangle ABC, base to side = 1 : 3
Base BC = 394
Sides AB = 1103.36, and AC = 1140.35
394 x 2.9 = 1142 ( Approx. 1 : 3)
Triangle DEF, base to sides = 1 : 4.236
Base DE = 663
Sides DF = 2809 and EF = 2839
663 x 4.236 = 2809 ( ratio = 1 : 4.236)
Now the 3rd base FG which is 2.0 expansion of 663 has completed but the
sides GH and GI/FH are yet to form in time.
Our projections are that if the growth process continues then we can expect
sides GH and GI/FH to be 5 times the value of the base vector AC or AB to maintain
the 1,1,2,3,5,8... Fibonacci series
AC = 1140
5 x 1140 = 5700 units (for GH and GI/FH)
The ratio of Base to sides must also be maintained at 1 : 4.236 to match
the vector expansion. ( Preferably 1 : 4.142)
Triangle base = FG = 1386 units
1386 x 4.142 = 5741 ( approx = GH =5700)
(The value 4.142 would be explained in next post)
Please check next post for continuation... thanks

PALLADIUM LONG TERM 3-DIMENSIONAL ANALYSISONE FROM OUR PRIVATE TRADES
Today we would discuss the current price structure of the Palladium market.
We would break the analysis into 3 parts in 3 different posts to make it simpler.
All our calculations will be in 3-Dimensional to reveal the composite geometric figures in motion
To begin with, lets remind ourselves that a golden triangle which is also an Isosceles triangle has
two sides equal in length and a 3rd side which is the base.
Radius Vector of a swing = Square root(Price ² + Time²)
For Cycle ABC:
Vector AB = root(703.5² + 850²) = 1103 units
Vector BC = root(225² + 323²) = 394 units
Vector AC = root(1075² + 380.5²) = 1140 units
Notice that radius vectors AB and AC have approximately the same lengths and they form 2 sides of the golden triangle or an Isosceles triangle. Vector BC is the base of the triangle and is approximately 3 times the sides AB and AC .
394 * 2.9 = 1142 units
Vector CD = root(373.22² + 1062²) = 1126 units
CD is also approximately the same length with AB and completes the harmonic AB=CD pattern.
Vector CD also defines the origin of the next growth phase or triangle DEF
For Cycle DEF:
Vector DE = root(498² + 438.32²) = 663 units
DE is the base of triangle DEF and is 1.667 expansion of the first base BC
394 * 1.667 = 657 units (short of 6 units)
Vector DF = root(1968² + 2005²) = 2809 units
Vector EF = root(1507² + 2405.94²) = 2839 units
The chart for DF and EF would be shown on next post but notice that vectors DF and EF are also
two sides of equal length and the base is 663 units
663 * 4.236 = 2808.47 = DF
663 * 4.272 = 2832.24 = EF
Now, this shows clearly that the sides of the 2nd triangle, DEF is 3 times the sides of the 1st triangle ABC
and the base DE is 1.667 expansion of base BC . (Base DE and BC are shown in blue on the chart)
AB = 1103 units
AC = 1140 units
DF = 2809 units
EF = 2839 units
The numbers 1, 2 and 3 are successive numbers in the Fibonacci series and the next number is 5.
The base expansion is 1 : 1.667 and the next base should have a value of 2 for a complete growth spiral.
Please check next post for continuation.

PALLADIUM LONG TERM 3-DIMENSIONAL ANALYSISONE FROM OUR PRIVATE TRADES
Today we would discuss the current price structure of the Palladium market.
We would break the analysis into 3 parts in 3 different posts to make it simpler.
All our calculations will be in 3-Dimensional to reveal the composite geometric figures in motion
To begin with, lets remind ourselves that a golden triangle which is also an Isosceles triangle has
two sides equal in length and a 3rd side which is the base.
Radius Vector of a swing = Square root
For Cycle ABC:
Vector AB = root = 1103 units
Vector BC = root = 394 units
Vector AC = root = 1140 units
Notice that radius vectors AB and AC have approximately the same lengths and they form 2 sides of the golden triangle or an Isosceles triangle. Vector BC is the base of the triangle and is approximately 3 times the sides AB and AC .
394 * 2.9 = 1142 units
Vector CD = root = 1126 units
CD is also approximately the same length with AB and completes the harmonic AB=CD pattern.
Vector CD also defines the origin of the next growth phase or triangle DEF
For Cycle DEF:
Vector DE = root = 663 units
DE is the base of triangle DEF and is 1.667 expansion of the first base BC
394 * 1.667 = 657 units (short of 6 units)
Vector DF = root = 2809 units
Vector EF = root = 2839 units
The chart for DF and EF would be shown on next post but notice that vectors DF and EF are also
two sides of equal length and the base is 663 units
663 * 4.236 = 2808.47 = DF
663 * 4.272 = 2832.24 = EF
Now, this shows clearly that the sides of the 2nd triangle, DEF is 3 times the sides of the 1st triangle ABC
and the base DE is 1.667 expansion of base BC . (Base DE and BC are shown in blue on the chart)
AB = 1103 units
AC = 1140 units
DF = 2809 units
EF = 2839 units
The numbers 1, 2 and 3 are successive numbers in the Fibonacci series and the next number is 5.
The base expansion is 1 : 1.667 and the next base should have a value of 2 for a complete growth spiral.
Please check next post for continuation.


After a huge run!Palladium is in a bearish and high volatility mood. In my opinion, it is in wave C from a high of 31 march.
It has been correcting 6 of April in a typical corrective channel. I would like to see a breakdown out of this channel with high momentum, then the accelerating fall would come which should drive the price of palladium below 1500 near to 1000
Waiting for the break


buy set up we will wait for the pullback between 50 and 61.8 fibo or breakout of the flag we enter buy . goodluck

Palladium may still drop a bit, but best believe it is bullishDemand will resume soon which means price will go up. Exactly when is hard to say, but it is sound logic. Palladium is needed for your car, when factories open up again, it is obvious what is going to happen. We have touched the first Fib. level and now appear to be going sideways. We could still drop to the Golden ratio but this could be an accumulation phase.

Palladium (XPDUSD): The end of its parabolic rise.Palladium has been rising non-stop for 4 years (since January 2016), a rise that after 2019 turned parabolic. This parabola has broken down this March as the pull back exceeded the 0.382 Fibonacci level that has been holding in the previous two cyclical pull backs (August 2018 and May 2019).
The 1W chart is on a neutral state (RSI = 53.141, MACD = 105.160, ADX = 39.528) as it has recovered 50% of the March sell-off, however the danger is far from over. Until the 2,900 High breaks, Palladium (XPDUSD) will most likely remain under selling pressure and the Higher Low trend line (red line) which has been supporting the 4 year uptrend may be tested. This test involves the 1W MA200 (orange line) both of which (HL trend line and MA200) can 'meet' on the 0.618 Fibonacci retracement (of the whole 4 year move). This (0.618 Fib) is at 1,390. If that breaks to then the next Support and potential sell target will be on the 0.786 Fib at 980 where Palladium can again start looking like a strong investment.
Keep in mind that we have been strong Palladium supporters for quite some time:
** If you like our free content follow our profile (www.tradingview.com) to get more daily ideas. **
Comments and likes are greatly appreciated.


PALLADIUM PointersTrading in middle of 1 - 1/2 Gann structure, a bullish scythe can be observed however it doesn't look that strong, do divergences continue through price lines? just curious. Clear fractal can be observed with these bearish divergences. Best to go long in this scenario, major precious metals will see large increases with global uncertainty rising.

XPDUSD | More DownsidePlease support this idea with LIKE if you find it useful.
Price was rejected by Resistance Node (50 MA, Ichi Cloud and the Resistance Trendline of the Descending Channel). It's more likely to continue the decline and retest the 200 MA
Thank you for reading this idea! Hope it's been useful to you and some of us will turn it into profitable.
Remember this analysis is not 100% accurate. No single analysis is. To make a decision follow your own thoughts.
The information given is not a Financial Advice.


