XPDUSD trade ideas

invest in palladium better than gold , ready to 2k targetinvest in palladium better than gold , ready to 2k target

Just Shorted Palladium The most recent bearish wave looks impulsive for me, usually impulsive strong waves are followed by short pullbacks and at least a resumption attempt of the initial impulse wave. The wave has taken the short to medium term trend line and printed a Gravestone doji candle.
My targets are outlined on chart.
Best
Tech

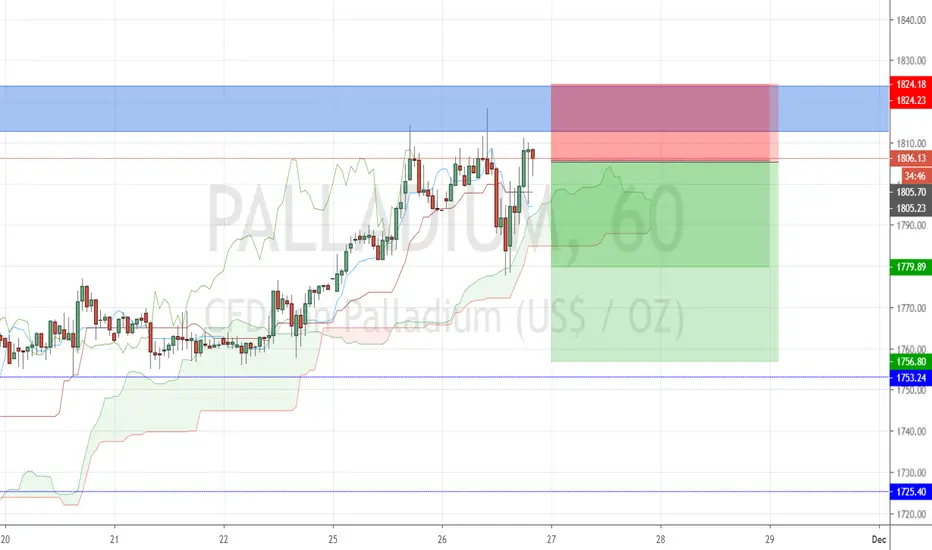
Lets short it again!I have been watching palladium since i got stopped out of my earlier short(see attachment). Now seems like the perfect inflexion point to get in for another short . The Monthly is showing a very slender hanging man after 2 months of strong bullish momentum.This is an early signal for bears to come. This bullish momentum broke the 1550-1570 zone (shaded in blue) and we expect test of that zone in December or January. This is the basis of our trades.The weekly has a double to forming and adds to confluence for a short on this commodity.
I like the H1 because just as i was looking for an entry a hanging man formed this past hour and that is an ideal place to start our shorts on Palladium. The blue resistance zone is the barrier at which all our stop losses should be located. The 1st part of our trades is up to the daily kijun zone then later on we will engage for the zone i mentioned above (1550-1570).
Entry: 2 positions @ 1805
SL: 1824
TP1: 1779
TP2: 1754
NB: Remember to manage risk and position size appropriately
Palladium: As Long as Equities are Bullish so is PalladiumWhile everyone continues to short Palladium for whatever reason, I have continued to make several hundred pips as precious metal trading not only involves technicals, but also understanding that they are not stocks and one must have an understanding of their uses, purposes, where they are mined, the economies of where they are mined, and so forth.
Many people shorted from 1685 which was the obvious carbon-copy correction from the preceding double peak. However, people held shorts afterwards hoping it would plummet to the 1400s which likely blew open many peoples accounts.
As long as equities remain elevated, Palladium will continue to rise. At this time I see Palladium reaching 2000 as a first TP. From there we sha'll see what happens as its impossible to predict where equities will be 3, 4, 5 or 6 months out from the time of writing this idea.
Palladium strength is tied to the economy (whether the economy is actually strong or weak but portrayed as strong, that is all that matters). As long manufacturing and productive capabilities of the overall economy stays reasonable, Palladium will remain elevated. In the longer-term, Palladium will remain "in-need" as countries around the world look for "environmentally friendly" options to improve carbon footprints from corrosion (i.e. for vehicles).
TLDR: It makes absolutely no sense to be long equities and short on Palladium which is exactly the trend you are seeing now.
- zSplit

Palladium formed a bearish bat patternPalladium formed a bearish bat pattern
around 1808 will be a good area to short
SL : 1830
TP : Follow arrow

[PALLADIUM] SHORT TRADEHi traders,
we will see palladium 1250-1300 dolares.
divergence in week and we have nice pull in daily.

PALLADIUM SHORT TRADEA clear bullish trend printed on the chart showing the buyer take control for the whole trend, however currently we are seeing a potential correction to create a new low that we can take advantage of. look for a retest of the broken neckline to confirm the resistance level before placing short trade.
_________________________________________________________________________________________________________________________________________
Traders! if you like my ideas and do take the same trade, please write it in comment so we can manage the trade together.
Disclaimer
the content on this analysis is subject to change at any time without notice, and is provided for the sole purpose of assisting traders to make independent investment decisions.
_________________________________________________________________________________________________________________________________________
Thank you for your support!
LamchiuFX


Palladium Being Rescued By The 50smaPrice has been doing well since breaking through the previous all-time high at $1,615
on 20th September 2019. Price rallied nicely, following the cup & handle pattern, until it
reached a high of $1,823 on 30th October 2019.
A pullback, which was to be expected, came down and even dropped 122 points in 2 days.
Day traders may have been scared off but as trend followers, we have kept our stops wide
enough to allow for this type of move without getting prematurely stopped out.
Right now, the 50 simple moving average is saving price from falling any lower and price appears
to be climbing up this sma.
There are two main potential outcomes going forward. Either price will head up and break
and close above the current high at $1,823. The other outcome is that price may come down
to find support at the previous all-time high at $1,615. Right now we are just managing our
investments in Palladium as there is no reason to exit just yet.
Palladium tends to endure deep pullbacks so we can expect a bumpy ride along the way up.
As long as you are managing your trades correctly then you should be able to ride the
trend all the way until the trend ends.
See below for more information on our trading techniques.
As always, keep it simple, keep it Sublime.

Palladium pullbackWe have broken the uptrend and are getting a nice correction to continue down to this trendline.

Palladium: Likely One More Pump Then ConsolidationPalladium has certainly shined brightly this year and has been one of the best performing assets all year - up 40-50% depending on your stock and entry in the precious metal.
Currently we formed a correction but have regained over 1700 status and I am eyeing some minor upwards consolidation for a few weeks with an eventual test of 1800, then a new ATH within the next 2-3 weeks before breaching around 2000 sometime later this year or into Q1 of 2020.
Once we breach into the 2000-2100.00 range I suspect economic data will begin (based on timing), to finally show-up in the equity market and this will hinder Palladium from further gains as a result of it being tied to manufacturing/productive capacity. However, with the world focusing on "clean", "green" and the "environment", Palladium's price should remain elevated at the 1600 level +/- 100.00 for several months before falling lower.
Once a recession happens (whenever that may-be - I forecast one by late 2020), I believe the price of Palladium will likely slip to anywhere from 1300 to 1400 (impossible to know exactly where).
For investors, Palladium is certainly a precious metal for long-term money; unlike Gold and Silver which are more fiat currency hedges, Palladium has mass "real-world" uses and its use will only surge as time progresses. For traders, there will be several good short opportunities but now is not the time.
- zSplit


Palladium Suffering From Big Selling!Palladium saw a 93% rally from the August 2018 low to the March 2019 high and with every
big move we can expect to see price become exhausted and form a pullback, reversal or consolidation.
In this case, we saw a period of consolidation which appeared in the form of a cup & handle pattern.
A cup & handle in an uptrend is a strong continuation pattern but only if the neckline is broken.
That did occur on September 19th 2019 and since then we have seen a 13% rally.
The pattern of trends followed by pullbacks continues and we are currently experiencing just that.
The current pullback has moved down 122 points in just 2 days and is currently finding support at the 50sma.
To confirm a continuation to the upside we want to see a break and close
above the October 30th high at $1,823.
If price fails at the current support area then we have the resistance turned support level at $1.615
which is a major support area.
We need to give price some time and space to move and as the overall trend is up,
the bias is for a continuation to the upside.
In the meantime, we have to see if price will follow the momentum and continue trending for some time.
See below for more information on our trading techniques.
As always, keep it simple, keep it Sublime.

Classic Kijun Breakout TestThis is a test of the kijun break on the daily. The analysis is similar to the Gold analysis and i have attached it.
Entry: 2 position after rejection from blue shaded area (1727-1728)
SL: slightly above tenkan 1761
TP1: 1637
TP2: 1570


XRP : Palladium trading ideaJust to share my current Palladium trading idea.
In my opinion, Palladium will probably want to test the support before it takes the next big step.
So the right time to buy has not yet come and is likely to be in the second half of November.
Of course, I can be completely wrong. Take care & good luck!

Palladium - CorrectionPalladium has confirmed a break of the uptrend line. To add to this signal, the top of this last move up coincides with the 161.80 fib extension level which could have been used as a profit taking level for longs.
A correction from here down to the 1615-1600 level (previous resistance zone) makes sense and this would be an ideal area to look for longs.
Shorting here is a risky option as it is a counter trend trade however previous corrections have been around 10-20% so a move down to the previous mentioned levels is a realistic scenario. Also there is an acceptable risk/reward ratio of approx. 1.4 if using the previous top as a stop loss level.
This analysis is for my own reference. This is not trading or financial advice.
Price Target 1615
ETA Early Dec

Is Palladium finally running out of steam?SHORT - XPDUSD
SL: 1811.95 (Suggested by our algorithmic system)
SL: 1832.00 (Safer option, personal suggestion)
TP: 1697.89
Reasons behind this idea:
1. Support trendline is subjectively broken.
2. MACD and Stochastic indicators have crossed down, bearish.
3. Minor RSI bearish divergence.
---------- Chart Drawings ----------
Blue Dotted Line: Broken Support Trendline (New Resistance Trendline)
Blue Solid Line: Next Supporting Trendline
Red Solid Line: Previous Resistance Trendline
Purple Line: Stoploss suggestion from our algorithmic system
Green Line: Take Profit suggestion from our algorithmic system
Red Arrow: Bearish Divergence
Screenshot of our mobile app alert: ibb.co (Timestamps are Australian Sydney Time UTC+7)
Please trade responsibly and good luck!


XPDUSD Intraday 6000pip sell signalAll indicators are co-centric and negative. All 4 averages cross below price in succession from shortest-term to longest term, indicating a high volume (large momentum) uninterrupted sale transaction;
The time frame of the event implies either news or selloff/take profit action rather than slow in industry demand.

Short-Term XPDUSD View1hr XPDUSD
Seeing the response of XPDUSD when passing through crosshairs.
Determine whether behavior indicates or predicts volatility
-50 cross below -200 has shown 14000pip fall within 3 days.
