palladium to attempt new ATH?Ascending triangle forming on PALLADIUM which could lead to a new high of 1919 if it pans out and stays on target. This would also be in line with the parabolic price rise that palladium has been having the last decade.
Entry on close above 1620 or on retest of support if it breaks
XPDUSD trade ideas


[Idea Long] PalladiumPalladium has been on an absolute tear recently, its massive rally in the second half of last year puts even gold to shame. It's one I wish I didn't miss out on.
Could it be consolidating, in this bull flag, for another major move higher? After all, Platinum is catching a bid too. They could all rally together on a precious metal bid. Or, it could be overextended, and need a pullback to 1150.
One could attempt a long with a tight stop under 1400. But definitely I think one should set an alert if it drops to 1150 as a strong buy level.


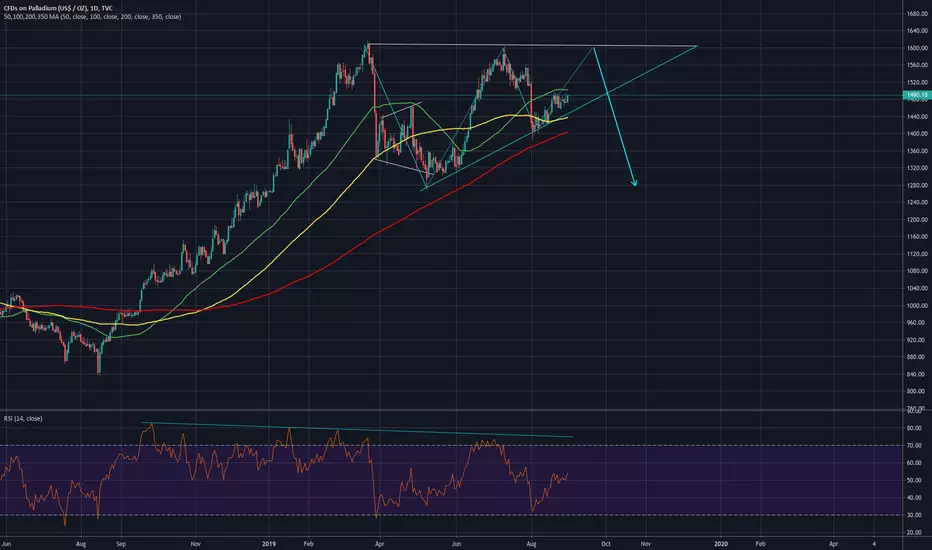
Is correction ending on Palladium?Palladium reached downtrend and preparing for the third test. 1500 dollar level will be the most important resistance to watch. As long as the resistance still valid price might break 1460 dollar bottom.

Palladium - Soon to be worth more than GOLDThe Palladium Market project the value and sales volume of Palladium submarkets, with respect to key regions.
This report presents the global “Palladium Market” size by value, production and consumption, splits the breakdown (Data status 2019 and forecast to 2025), by manufacturers, region, type and application.
This study also explores the market status, market share, growth rate, future trends, market drivers, opportunities and challenges, risks and entry barriers, sales channels, distributors and Porter's Five Forces Analysis.
Palladium is a soft silver-white metal that resembles platinum. It is the least dense and has the lowest melting point of the platinum group metals. It is soft and ductile when annealed and is greatly increased in strength and hardness when cold-worked. Palladium dissolves slowly in concentrated nitric acid, in hot, concentrated sulfuric acid, and when finely ground, in hydrochloric acid.
In 2019, the market size of Palladium is xx million US$ and it will reach xx million US$ in 2025, growing at a CAGR of xx% from 2019; while in China, the market size is valued at xx million US$ and will increase to xx million US$ in 2025, with a CAGR of xx% during forecast period.
In this report, 2018 has been considered as the base year and 2019 to 2025 as the forecast period to estimate the market size for Palladium.
The following Manufacturers are covered in this report:
Evonik
BASF
Johnson Matthey
Heraeus
Shanxi Kaida Chemical Engineering Co.Ltd

palladium : neutral palladium : neutral : waiting air gap fall after good 1381 to 1499 rally , we need to break 1500 to target 1600 points

GOING LONGMY REASONS FOR THIS MOVE: 1.STRONG FORECAST US DATA TODAY 2.MOMENTUM TO THE UPSIDE 3.CANDLESTICK ENGLUFING ON 1HR

XPDUSD sell setupHi guys, I am looking to sell this pair , waiting for confirmation first after breakout is a good idea.
Trade With Care.
Thank You For Your Support.

GOING TO SELLCONFLUENCES ARE 1. RISING WEDGE REVERSAL PATTERN 2. DAILY ENGULFING CANDLESTICK 3. US INDEX IS AT DAILY RESISTANCE

XPD USD SELL (PALLADIUM - US DOLLAR)Hi there. Price is forming a continuation pattern to the downside. Wait for the price to complete the pattern and watch strong price action for sell.

Divergence and positive trendShowing bullish divergence and maintaining positive trend. 1st target 1520, stop at the trendline.


Bearish Pennant on XPD/USD (Palladium) @ D1This bearish pennant formed on the XPD/USD @ D1 offers a bearish breakout opportunity. The pennant and its pole are marked with the yellow lines. My potential entry level is the cyan line. My potential take-profit level is the green line. The stop-loss level is already marked on the chart.

$BTC triangle scenario Update/ Palladium fractal comparisoni updated this alternate scenario for BTC just incase this forms in the future
attached palladium fractal which shows the same mathematical fibonnaci sequence
for this forecast


XPD USD SELL (PALLADIUM - US DOLLAR)Hi there. Price is forming a continuation pattern to the downside. Wait for the price to complete the pattern and watch strong price action for sell.


PALLADIUM Lower Buy SignalPattern: Rectangle on 1W.
Signal: Bullish once it approaches the 1W Support Zone.
Target: 1600 (right below the 1W Resistance Zone).

