$palladium/ $XPDUSD small long againSmall long here, I will add depending on the price action.
Reasons for the trade:
-acceleration to the downside
-anticipating a false breakdown(maybe the add will be after we get back above 950)
-divergence on the daily TF
-some round price numbers
XPDUSD trade ideas

Palladium AccumulationI expect palladium to start an accumulation process in the following months for the following reasons:
Technicals:
Palladium is in an untested demand zone which includes 5 years and 10 years
It is in an untested demand zone which correspond to the restest of 2001 highs and the breakout of 2018
There is a divergence on the MACD
Seasonality is positive from mid December to March
Positioning:
The number of speculators shorts are at an all time high in the COT reports of Palladium Futures
Fundamentals:
Lower rates should support higher prices
Palladium is mainly used in catalyst from fuel-engined cars. The demand for hybrid cars and plug-in rechargeables is expected to increase a lot in the coming years especially in the US and Canada where fully EVs are not ideal because of long distances vs Europe.
In the short term I think palladium can go to 1350.

XPD correction is about to cool down before CCurrently we are in ABC correction. A point is near and soon we will see movement from A to B .
Short term - no position before shorting - time to wait before continue with trend

📈📊 #ChartPattern Alert! 📈📊 📈 Rising Wedge 📈📈 What is a Rising Wedge? The Rising Wedge is a bearish chart pattern characterized by two converging trendlines, with the lower trendline sloping upward more than the upper trendline. It typically signals a potential bearish reversal, with the price likely to break downward after the wedge pattern.
📈 How to Identify:
Draw a trendline connecting at least two lower highs (upper trendline).
Draw another trendline connecting at least two lower lows (lower trendline).
📈 What it Signals: The Rising Wedge suggests a potential bearish reversal, with sellers prevailing at lower highs within the wedge. It often forms during uptrends and can precede a significant price move to the downside.
📈 Trade Strategy:
Consider short-selling or setting stop-loss levels if the price breaks below the lower trendline of the Rising Wedge.
Set profit targets based on the pattern's height subtracted from the breakdown point.
Implement a stop-loss to manage risk in case of a false breakdown.
Remember to use other technical indicators and conduct thorough research to support your analysis before making any trading decisions. Happy charting and trading! 📉💹

XPDUSD BUYThere seem to be a trend reversal on major support for Palladium at 1000.
Lets ride this thing back up.
www.tradingview.com

$Palladium close to 1000$/Oz again the break of 1000 was a false breakout?
I do not know, but I will try a long here risking the lows + some change

#XPDUSD Palladium reaching long-term accumulation levelsPalladium is starting to pique my interest. After retreating from as high as $3000 at the peak in April 21' - the commodity is now down 65% and reaching interesting long term levels. Firstly the current level at approximately $1025 is where palladium peaked as far as back in January 01' - almost 22 years ago. If this becomes a point of polarity, the previous top(resistance) should start to morph into support. This level was also tested in late December 2017 after not having made new highs for 16 years! To think that the commodity is basically flat from the highest point some 22 years ago is quite something...
What makes this level even more interesting to me is that we have approached the 200 month moving average (green moving average on the chart). Interestingly, this is where the palladium price bottomed back in Late 2016 before rallying almost 500% to reach the Peak of $3000 in April 21'. Also, if you look at the RSI and MACD indicators at the bottom of my chart, you will see just how oversold the commodity is. To put it into perspective, the only time we were more oversold going back to 1997 (which is as far as i can go), was April 2003 where we traded as low as $150...
I would start accumulating here, with scope to add down at $850 should it get there, which is where we find the uptrend connecting the 2008 and 2016 lows. I will be surprised if we get that far, but I will start accumulating from current levels for a move higher. We are so stretched in price here that I do expect some mean reversion to take place in the weeks and months ahead. We are already starting to see mines having to close shafts which is telling you that PGM prices at these levels are not sustainable and something has to give sooner or later...

XPDUSD Price rebounding at the bottom of the Channel Down.Palladium (XPDUSD) has been trading within a Channel Down pattern since late June and on Monday the price hit its bottom (Lower Lows trend-line). As the 1D RSI touched the 30.00 oversold barrier on a Lower Lows formation that has previously formed short-term bottoms for Palladium, we expect a rebound towards the 1D MA50 (blue trend-line). The lowest rebound sequence within this period has been +9.00% so a 1185 target perfectly fit those criteria as well as a potential contact with the 1D MA50.
-------------------------------------------------------------------------------
** Please LIKE 👍, FOLLOW ✅, SHARE 🙌 and COMMENT ✍ if you enjoy this idea! Also share your ideas and charts in the comments section below! This is best way to keep it relevant, support us, keep the content here free and allow the idea to reach as many people as possible. **
-------------------------------------------------------------------------------
💸💸💸💸💸💸
👇 👇 👇 👇 👇 👇

PALLADIUM - Near Good Buy PointA strong trend line emerges when drawn like this.
At roughly ~1100 a reversal or bounce from this strong downward movement may be seen

Palladium seems like a very good opportunity to me.Hello everyone,
How Rare is Palladium?
Palladium is considered a relatively rare precious metal. It is rarer than well-known precious metals like gold and silver and it seems like a very interesting opportunity at the moment to me.
There is lot of bullish signs I can see.
First of all It seems like it is in nice falling wedge pattern and finishing A-B-C-D-E correction. Very solid bullish divergence is forming on the Weekly time frame and it seems like it broke the red resistence line and its just testing it. Reversal should start soon for this precious metal
I see 50-400% Gains from here.
There is very solid setup for mid to long term trade as well as a long term investment.
If you Zoom out to the Monthly
Hope this helps you.
Cheers
A precious metal is a naturally occurring metallic element with high economic and cultural value due to its rarity, luster, and various industrial and ornamental applications. Palladium is a precious metal with unique properties and commercial importance akin to its renowned counterparts like gold, silver, and platinum.
What is Palladium?
Palladium is a silvery-white transition metal belonging to the periodic table’s platinum group of elements. William Hyde Wollaston discovered palladium in 1803 and named it after the asteroid Pallas, which was discovered around the same time. Palladium is known for its distinct luster, durability, and high resistance to corrosion, making it a valuable material in various industrial and technological applications. It has also become popular in recent years to invest in palladium.
Palladium, Bitcoin, BTC,R:R, money management, risk, reward, technique, style, trading, bitcoin , bitcointrading, profitable trading, profittrading, profit trading, secret, divergence, bull divergence, bear divergence, divergencetrading, divergence trading, trading strategy, how to trade bitcoin , bitcoin trades, bitcoin trading, make profit, take profit, trading strategy, trading technique, successful, successful trader, successful technique, successful strategy, successful secret, how to trade, trend analysis, technical analysis , indicators, rsi , relative strenght index, let it rain, successful life, easy strategy, easy trading, easy technique, make money, crypto investing, investing, crypto, cryptocurrency, cryptocurrencies, mentoring, money, chartart, beyond

Palladium $ssw $sbsw $pallPalladium has reached support and reversed at the intersection of the long term trend line and the 0.886 fib retrace. This is a tight market with a historical large amount of short positiosns so could experience a significant short covering rally.

Palladium has posted another bearish engulfing.Palladium - 24h expiry
The primary trend remains bearish.
The bearish engulfing candle on the 4 hour chart is negative for sentiment.
Trading has been mixed and volatile.
Expect trading to remain mixed and volatile.
Rallies should be capped by yesterday's high.
Although the bulls are in control, the stalling positive momentum indicates a turnaround is possible.
1277 has been pivotal.
We look to Sell at 1276.7 (stop at 1292.7)
Our profit targets will be 1236.7 and 1226.7
Resistance: 1255 / 1270 / 1280
Support: 1244 / 1225 / 1200
Risk Disclaimer
The trade ideas beyond this page are for informational purposes only and do not constitute investment advice or a solicitation to trade. This information is provided by Signal Centre, a third-party unaffiliated with OANDA, and is intended for general circulation only. OANDA does not guarantee the accuracy of this information and assumes no responsibilities for the information provided by the third party. The information does not take into account the specific investment objectives, financial situation, or particular needs of any particular person. You should take into account your specific investment objectives, financial situation, and particular needs before making a commitment to trade, including seeking advice from an independent financial adviser regarding the suitability of the investment, under a separate engagement, as you deem fit.
You accept that you assume all risks in independently viewing the contents and selecting a chosen strategy.
Where the research is distributed in Singapore to a person who is not an Accredited Investor, Expert Investor or an Institutional Investor, Oanda Asia Pacific Pte Ltd (“OAP“) accepts legal responsibility for the contents of the report to such persons only to the extent required by law. Singapore customers should contact OAP at 6579 8289 for matters arising from, or in connection with, the information/research distributed.

XPDUSD: Engage above or below this Channel. Neutral within.Palladium has been trading relatively sideways as its inside a low slope Channel Down pattern since June 27th. There is no surprise that the 1D technical outlook is neutral (RSI = 54.874, MACD = -7.340, ADX = 26.821). Consequently you can scalp the Channel's range on the short-term on trade the direction of the breakout on the longer one.
If the price delivers a 1D candle closing over the top of the Channel Down (and most likely the 1D MA100), buy and target the 1D MA200 (TP = 1,400). If the price delivers a 1D candle closing under the bottom of the Channel Down, sell and target the end of a -26% decline (TP = 985.00).
## If you like our free content follow our profile to get more daily ideas. ##
## Comments and likes are greatly appreciated. ##

PALLADIUMHI my friends again i am back to you....these two major trend line in PALLADIUM chart are catching my eyes .....that is my buy level .....
Gooooood Luuuuuuck

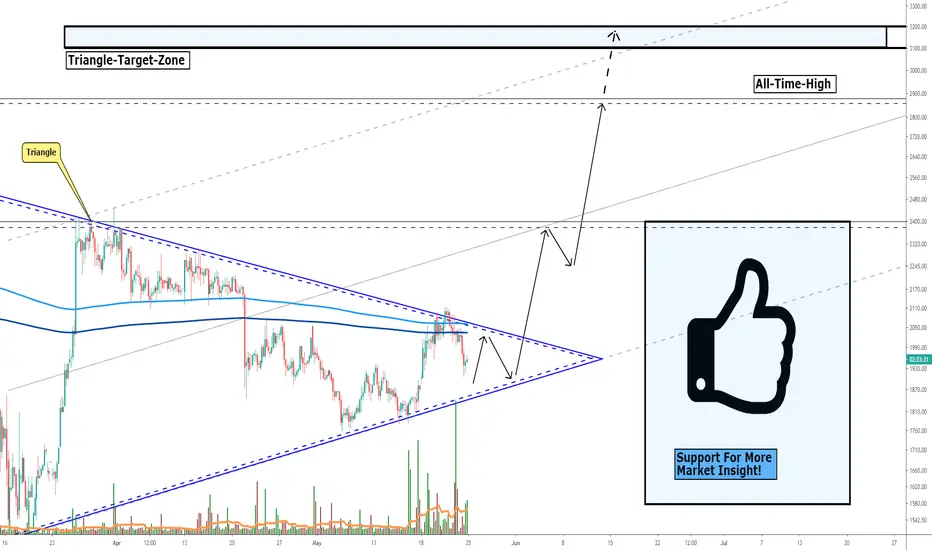
PALLADIUM, Trading Near A-T-H, Targets Ahead When Confirmed! Hello Traders Investors And Community, welcome to this analysis where we are going to look at palladium, its price-action, and what we can expect from the future hours and days. It is one of the important metals and therefore a demanded exchange good in today's global economy. In my observations, I found some important and significant signs which will affect the price further and determine its outcome, therefore we are looking on the locally 4-hour timeframe.
As you can see in my chart palladium currently trades in a huge triangle which you can see marked in blue in my chart in which we have good bullish volatility and support at the moment which indicates a highly possible breakout to the upside as you can see the arrows marked in my chart. At the moment the bullish scenario is more likely because we have strong support in the range and has some good bullish volume but also we are still trading in a big correction that isn't completed yet.
After the triangle has confirmed properly we can expect palladium to test its higher levels, firstly it will be the middle line of the channel as you can see it in my chart when the price and trend stay stable in this region we can expect palladium to move higher at least testing the higher boundary of the uptrend channel and the all-time-high, as you can see the all-time-high is just slightly below the overall triangle target when this target is finally reached it can provide a new all-time-high which will be extremely bullish and can catapult palladium to next highs.
Remember that this scenario has to be confirmed properly, first we have to break the upper boundary with good volatility and close above the 600 and 800-EMA which you can see marked in my chart in light and dark blue. To wait on the right confirmation is the best option wise traders can do in today's market environment, otherwise, trading half-cooked and speculative setups can lead to unsatisfying results therefore it is important to always look and trade the best possible setups which today's market environment can provide to us.
Thanks to everybody for watching, support for more market insight, and all the best!
The ambition to transform opportunity into gold remains the most significant tool for a trader.
In this manner: FAREWELL
Information provided is only educational and should not be used to take action in the markets.
🚀Palladium Primed for Explosive Move! Bullish Confluence Signal🔍Technical Analysis:
Chuvashov's Fork Breakout: We are soon gonna witnessing a clear breakout from the Chuvashov's Fork pattern. For those unfamiliar with this pattern, it is a bullish reversal signal, and the current breakout could serve as a strong indication that the tide is turning in favor of the bulls.
Bullish Divergence - RSI and Price: Both the daily and weekly timeframes are showing a bullish divergence between price and RSI. Historically, this has often been a precursor to significant price rallies.
Oversold Territory: After a 66% decline from its highs, Palladium is deep into oversold territory. From a contrarian standpoint, this could indicate a significant bounce-back is on the horizon.
📊Fundamental Analysis:
Miners Bullish: The individuals closest to the supply chain, the miners, are positioning long. They usually have a keen insight into the market's fundamentals, and their bullish stance speaks volumes.
Record Short Positions: An unprecedented volume of short positions in futures is currently in play. If we consider the limited supply available to cover these shorts, a scenario unfolds: a massive short squeeze.
🚀Projection:
Given the potent combination of the technical and fundamental factors at play, it's plausible we could witness a monumental short squeeze. This squeeze could propel Palladium prices from their current standing around $1200, launching them towards the $2000 range, if not beyond.
Disclaimer: Always conduct your own research and consult with a financial advisor before making any investment decisions. This analysis is based on personal opinion and is not financial advice.
📈**#PalladiumToTheMoon** 🌙

Palladium: Waiting for a long entryIt's been a while. I never stopped trading, but I did stop posting.
Let's share some ideas again!
I'm patiently waiting for a long entry in TVC:PALLADIUM
Palladium weekly chart
MACD:
The macd crossover indicates an upward correction in a downtrend.
The positive divergence indicates a possible trend reversal
Confirmation after crossing 0-level.
RSI
Positive divergence RSI confirms and indicates an upward correction a downtrend and a possible trend reversal.
Trend reversal confirmed aftering crossing the 50 level.
Happy trading! :)
Waiting for an entry #long

Palladium - Forming a basePalladium price, after also breaking a couple of key levels to the downside, has seemingly formed a base around 1220. It could still overshoot and test support lower down at around 1143. The bullish case needs to see price action break above resistance at 1350 in which case it could target around 1550 initially.

Palladium - Bullish divergenceThe noble metal of Palladium has undergone a robust correction of fifty percent since the waning days of March in the year 2022. This fortuitous circumstance has begotten a plethora of reasons for one to adopt a bullish outlook. They include..
1) Price action and RSI resistance breakouts.
2) Bullish divergence. Six oscillators now print positive divergence with price action as measured over a 9 month period. Look left.
3) Not a big fan of targets. However the falling wedge pattern + breakout confirmation now forecast a 3000+ target.
Alas, is it not within the realm of possibility that the price action may suffer a further descent? Regrettably, this rhetorical inquiry must be met with an affirmative response. But, I beseech you, dear reader, to meditate on the concept of probability, for it is in this realm that the prospect of such an event becomes most implausible.
Gwd I need to stop reading the great works for Christopher Hitchens.
Ww
Type: Trade
Risk: <=6% of portfolio
Timeframe: Long from 1300 as the market allows.
Return: 100%

Would Palladium be ready for a Comeback? It seems possible...Whenever something goes unnoticed for too long, it's usually a good opportunity...
In this case it would not be so unfounded, because however you spin it, you need the real cars at some point, there is no way around it.

PALLADIUM - Return to Trend LinesThe green trend line would be the optimal recovery point but the dashed line below is also suitable.
Bars pattern showing my thinking of how price will act.
The green line is a strong trend line.

Palladium $: another leg down?A price action below 1220 supports a bearish trend direction.
Further bearish confirmation for a break below 1200.
The target price is set at 1110.
The stop-loss price is set at 1310.
The start of downside price momentum (see the lower panel) remains a concern for further downside.

Palladium on 4h Hello traders,
Here is my expectations on Palladium until the end of the year.
Good luck all!
This is not a financial advice!
