XPTUSD BULLISH OUTLOOKPlatinum futures are currently trading at around $925 per ounce, not far from an 8-month low of $894 hit on June 28th. The market is currently focused on concerns regarding China's growth recovery losing momentum and has already factored in a projected deficit for this year. Despite demand concerns in China, the World Platinum Investment Council has revised its deficit forecast for 2023, anticipating a significant 77% increase. This revision is driven by a projected 28% growth in demand and a 1% decline in supply compared to the previous year. Industrial demand is expected to reach record levels, increasing by 17% due to glass capacity expansions in China. Additionally, platinum automotive demand continues to rise in 2023, up 12% due to increased loadings and substitution.
Risk Disclosure: Trading Foreign Exchange (Forex) and Contracts of Difference (CFD's) carries a high level of risk. By registering and signing up, any client affirms their understanding of their own personal accountability for all transactions performed within their account and recognizes the risks associated with trading on such markets and on such sites. Furthermore, one understands that the company carries zero influence over transactions, markets, and trading signals, therefore, cannot be held liable nor guarantee any profits or losses.
XPTUSDG trade ideas


Sideway Structures!! BullishHi guys
I hope you have a wonderful week of successful and profitable deals.
Elliott wave principle analysis
Friends, all the necessary information is provided in the chart.
I sincerely appreciate your support.
with best wishes!

Platinum Hi guys : in terms of education : after fake out we can expect huge upside fast movement in price ....... target is clear on the chart ....
Good luck

Small trade leverage x10looking for a small breakout above daily is oversold 4 hour bullish divergence is starting to come up

Platinum - Should bouncePlatinum price is currently testing double support - white horizontal and the more important blue TL which is also the bottom of the range of a larger bullish channel.
Ideally, we would like to see above higher from here to around 1150 - 1190. Alternatively, targets to the downside are 918 and possibly 830.

If XPT Bullrun starts how high I see itIf XPT bottomed is in and bulls wants to take over.
The recent high was 2300… but can it go higher. Bet it can if it goes any higher then I’ll say around $3000.
If the 900$ area still strong as it is and going to break out.. then my target for the Platinum ATH is 3000$ but maybe you think could go maybe 5000$.
What do you think? If platinum bottomed in and bull run starts how high do you think the new bull run ATH will be ? Comment down

Flat patternHi guys
I hope you have a good week, experience successful and profitable deals
Elliott wave principle analysis
Friends, all the details are indicated in the chart
Thank you very much for your support
Good luck!

XPT/USD Long ideaAccording to the FED hawkish stance, this will be a risky trade right now.
If we don t see a strong comeback from the 0.239 fib level which acts as a support, i expect it to go below and touch again the 800 price.
We already broke down the long term support as i said it s risky.
It s just an idea and i will take action based only on my analysis, do your own research !!!!
Feel free to correct me i like to learn from y all.

Platinum is at the triple supportPlatinum hit the triple support: weekly S2 pivot points, green lower band of up trend and horizontal band from long-term price action. Platinum is so cheap compared to historical prices and gold. It seems that NASDAQ:NDX vacuums some money from commodities and crypto, but stock market is close to a correction which may bring some money back to commodities. I expect OANDA:XPTUSD would over-perform Silver and Gold.
Disclaimer – WhaleGambit. Please be reminded – you alone are responsible for your trading – both gains and losses. There is a very high degree of risk involved in trading. The technical analysis , like all indicators, strategies, columns, articles and other features accessible on/though this site is for informational purposes only and should not be construed as investment advice by you. Your use of the technical analysis , as would also your use of all mentioned indicators, strategies, columns, articles and all other features, is entirely at your own risk and it is your sole responsibility to evaluate the accuracy, completeness and usefulness (including suitability) of the information. You should assess the risk of any trade with your financial adviser and make your own independent decision(s) regarding any tradable products which may be the subject matter of the technical analysis or any of the said indicators, strategies, columns, articles and all other features.

PLATINUM SWING LONG TRADETrade setup: XPTUSD 4H - SWING TRADE LON
- 72,65% of Institutions are holding LONG positions in Platinum
- Daily timeframe in uptrend (made new higher)
- 4H downtrend broken by strong demand zone
- 15 minute timeframe has inverse head & shoulders as confirmation

Platinum- Inverted head and shouldersPlatinum has started the month with a local low shy under 1k psychological figure, a reversal followed which also led to a break above the descending trend line started in May.
At this moment the price is exactly in the horizontal 1040 resistance and a break above this zone would also confirm an inverted H&S pattern.
Buy trades considering this setup would have a perfect 1:2 R: R

Platinum, could this be a new swing higher?Today's focus: Platinum
Pattern – Support hold, trend break
Possible targets – 1070
Support – 993
Resistance – 1035, 1070
Today’s update is on Platinum. We have run over our thoughts and levels we are watching. Yesterday’s solid rally has held support and has started to test support after breaking the current downtrend. Will we see buyers clear resistance and confirm the trend break?
Thanks for stopping by. Good trading, and have a great day.

Platinum's Bearish Path: A Closer Look at the Price ActionPlatinum continues to be confined within a persistent bearish channel, characterized by a pattern of lower highs and lower lows in its price movement. This ongoing trend suggests a prevailing bearish sentiment in the market. As the price of platinum remains locked within this channel, there is a possibility of a new bearish impulse emerging.
Given the current market conditions and the downward trajectory of platinum, our target for the foreseeable future remains at $985. This target signifies a further decline in the price of platinum, aligning with the prevailing bearish outlook. Traders and investors should closely monitor the price action and market developments to assess potential opportunities within this bearish context.

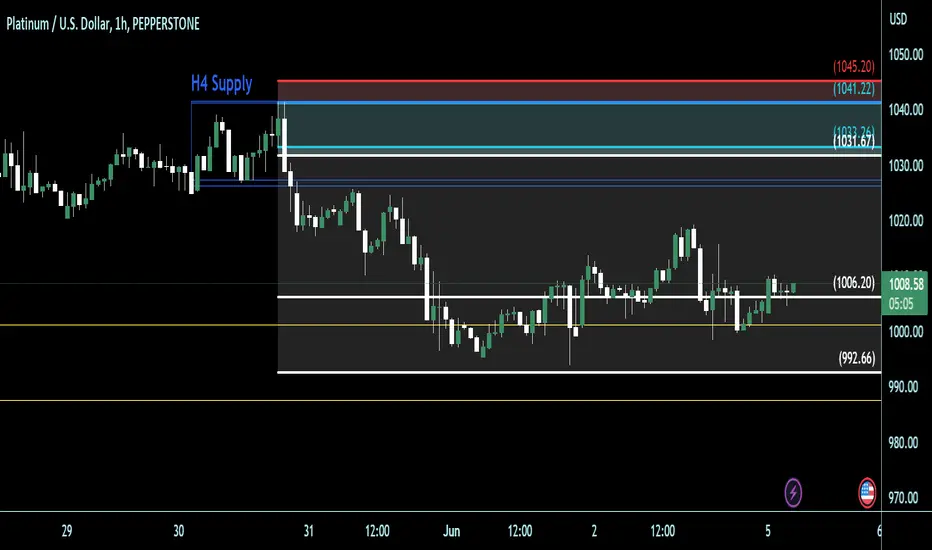
SHORT - XPTUSD (H1) (5 Jun 2023)Intraday Trade - XPTUSD
In the Weekly Chart, price is coming from the Supply, and there is room to the opposing zone.
In the Daily Chart, wait for price to clear the D1 demand zone that is in the middle of the chart, before looking for selling opportunities in the lower timeframes i.e. H4. Intraday trades can be found in the H1 chart as well.
In the H4 chart, I am looking to SHORT within the H1 zone to make the risks smaller.
FINANCIAL MARKETSOnce upon a time, in the bustling streets of 17th-century Amsterdam, an extraordinary concept was born that would transform the world of finance forever: the stock market. It was a time of exploration, trade, and economic growth, and the Dutch Republic stood at the forefront of this new era.
In the early 1600s, the Dutch East India Company (Vereenigde Oostindische Compagnie or VOC) was established, becoming the first multinational corporation in history. The VOC aimed to capitalize on the lucrative spice trade with the East Indies and sought to raise vast amounts of capital to finance its expeditions.
To achieve this, the VOC devised a revolutionary plan. Instead of relying solely on wealthy merchants or monarchs to fund their ventures, they decided to offer shares of the company to the general public. These shares represented fractional ownership in the company and entitled the holders to a share of the profits.
The VOC's decision to issue shares to the public was groundbreaking. It allowed individuals from various walks of life to invest in the company and reap the benefits of its success. Investors eagerly snapped up these shares, leading to the birth of a secondary market where these shares could be bought and sold.
To facilitate the buying and selling of shares, the world's first formal stock exchange was established in Amsterdam in 1602. Known as the Amsterdam Stock Exchange, it provided a central location where traders could gather and exchange shares of the VOC and other companies. This marked the beginning of organized trading and the birth of the financial markets as we know them today.
The stock exchange quickly gained popularity, attracting investors from all corners of Europe. Merchants, nobles, and even small-time traders flocked to the exchange, seeking opportunities to profit from the flourishing trade and expanding global economy. The stock market became a symbol of economic prosperity and a catalyst for further growth.
As the stock market flourished, it began to evolve and adapt. New financial instruments emerged, such as options and futures contracts, allowing investors to speculate on the future value of various assets. Investment banks and brokerage firms sprouted up, providing services to investors and further fueling the growth of the financial sector.
Over time, stock exchanges spread across the world, with London, New York, and other major cities establishing their own marketplaces. The stock market became a vital component of modern economies, providing a mechanism for companies to raise capital and investors to allocate their resources.
However, with its growth and increasing complexity, the stock market has also faced its fair share of challenges. Market crashes, economic recessions, and regulatory issues have tested its resilience. Yet, despite these setbacks, the stock market has persisted, adapting to new technologies and market dynamics.
Today, the stock market remains a central pillar of the global financial system. Billions of dollars are traded daily, connecting investors, businesses, and governments across the world. It continues to be a place of opportunity, risk, and innovation, shaping the economic landscape and reflecting the aspirations and fluctuations of societies.
The story of the stock market is one of human ingenuity, ambition, and the pursuit of wealth. From its humble beginnings in the 17th century to its current status as a global financial powerhouse, it stands as a testament to the power of markets and the enduring human desire for growth and prosperity.
WHAT IS THE TERM "HEDGING"?
in the financial realm, the concept of hedging, or mitigating risks, has been practiced for centuries. While it's challenging to pinpoint the exact birth of the first hedge, we can explore the origins of hedging and how it evolved over time.
Hedging can be traced back to the earliest forms of agricultural societies. Farmers, who were at the mercy of unpredictable weather conditions and crop yields, sought ways to protect themselves from potential losses. They adopted strategies such as diversifying their crops, storing surplus produce, and entering into agreements with other farmers to share risks.
The development of organized markets further facilitated the practice of hedging. In ancient civilizations like Mesopotamia and Egypt, farmers and traders engaged in forward contracts, which allowed them to lock in prices for future transactions. These contracts acted as a hedge against price fluctuations, ensuring a certain level of certainty in an uncertain market.
As trade and commerce expanded, so did the need for hedging beyond the agricultural sector. In ancient Greece, merchants and shipowners faced risks associated with maritime trade, including storms, piracy, and shipwrecks. To mitigate these risks, they would spread their investments across multiple voyages, diversifying their cargo and destinations. This approach served as an early form of hedging against potential losses.
The formalization of financial markets in medieval Europe laid the foundation for more sophisticated hedging strategies. Merchants engaging in long-distance trade began to use bills of exchange, which were essentially early forms of negotiable instruments. These bills allowed merchants to hedge against currency and credit risks by transferring their debt obligations to a third party at a discount, reducing their exposure to potential losses.
In the 17th century, options and futures contracts emerged as key hedging instruments. These contracts provided traders with the right to buy or sell assets at a predetermined price within a specific timeframe. Options and futures allowed market participants to hedge against price fluctuations and protect their investments by locking in prices in advance.
One notable example of early hedging can be found in the tulip mania that swept through 17th-century Holland. During this period, the price of tulip bulbs skyrocketed to absurd levels, driven by speculative fervor. Sensing the growing bubble, some traders began selling short tulip bulb contracts, effectively betting that the prices would decline. This early form of short selling acted as a hedge against potential losses if the bubble burst, enabling traders to profit from falling prices.
The development of modern financial markets and the growth of complex financial instruments in the 20th century further expanded hedging strategies. Innovations such as options, futures, swaps, and derivatives allowed market participants to hedge against a wide range of risks, including interest rates, exchange rates, and commodity prices.
It's important to note that hedging, while an essential risk management tool, can also be used for speculative purposes. Traders and investors often engage in hedging strategies to take advantage of market inefficiencies and price differentials.
In conclusion, while the birth of the first hedge cannot be attributed to a specific event or individual, the practice of hedging has evolved over time as a response to the inherent risks of various economic activities. From ancient agricultural societies to modern financial markets, the concept of hedging has become an integral part of managing risks and ensuring stability in an ever-changing economic landscape.

XPTUSD Buy opportunity with High expected in June.Platinum (XPTUSD) is trading on a Triangle pattern which is within a larger Channel Up. Last time we had this sequence on patterns was last November-December. Once the price hit the 1D MA50 (blue trend-line), it rebounded to the 1.5 Fibonacci extension. The current 1.5 Fib is at 1180 but we set a Target slightly lower at 1170. Notice how even the 1D MACD sequences between the two fractals are identical.
-------------------------------------------------------------------------------
** Please LIKE 👍, FOLLOW ✅, SHARE 🙌 and COMMENT ✍ if you enjoy this idea! Also share your ideas and charts in the comments section below! **
-------------------------------------------------------------------------------
💸💸💸💸💸💸
👇 👇 👇 👇 👇 👇

Coming to the end of B wave Triangle?It's possible that it's approaching a significant top, around $1200 level, in an E Wave. This would be inside a B Wave triangle. It could take it down to around the $400 level.

Corrective pattern!!! or bullish???Hello friends, have a good time
Platinum = Dollar
Initiation ($816.50) of an impulse pattern followed by a large zigzag pattern that corrected 61.8% to 78.6% of the first wave has now reached its all-time high of $1133.26!
Of course, it seems that one more wave is left to complete the impulse pattern and then any correction pattern will be formed, the bullish market will follow with more strength. (The first possibility).
Second possibility: Currently, the market is in a double or triple zigzag pattern, and the bearish market will continue, and it may go up once more, and then to complete the lateral correction pattern (double triple, flat).
Then we will see the development of the platinum market.
Good luck! I hope you are having a good week ahead.
Thank you for your support
Corrective pattern!!! or bullish???

W9.1-30 PLATINUM BEARISH IDEA Potential Bearish Entry
Dow Theory In Place - Lower High and Lower Low Expected in Place
Formation of DOUBLE Top coupled with bearish divergence (Bearish reversal pattern)
SL & TP Levels are defined.

Will Platinum price explode to the upside?Since the Platinum Bobble burst back in 2008, the price was unable to recover, regardless of the all-time high on other PMs.
However, looking at the weekly posted chart we can see that the low after the burst held extremely strong, and after January's higher low, XptUsd also has broken above the falling trend line.
At this moment the road to 1350 resistance is cleared (medium term) and, a break above this level could lead to further gains to 2k in the long term.


Time to buy Platinum?Platinum currently is nearly the cheapest it has been relative to Gold in the last 23 years.
Just a quick look at the spread...
Gold may drop more relative to platinum, resulting in a regression to the mean. So Platinum doesn't have to go up for this to change.
Platinum may have demand in hydrogen fuel cells, so potentially a good future investment idea.
It is a fringe precious metal, with a high price volatility.
