XPTUSDG trade ideas


Bullish opportunity for the metalPrice is consolidating inside a pennant which is bullish continuation pattern. If bulls accumulate enough moment we might see price breaking above the bullish pennant with a potential run up to $1,350

Platinum likely to find buyers near current levelPlatinum has experienced a strong breakout in the first half of February after which it touched a high of $1,337 on 16th February, since then it has experienced a correction and is currently trading near $1,245. Further it is near the 38.2% retracement support of the rally experienced from 28th January to 16th February, suggesting a rebound is likely from current levels. It would be prudent to say that Platinum could rise towards $1,285 and $1,320 while it sustains above $1,200.
Risk Disclaimer:
Trading Forex or any CFD products may not be suitable to all investors and they must evaluate their risk appetite. The above article should not be construed as a trading or investment advice as it is solely for education and information purpose only. Trading might incur a loss of capital and hence investors might be required to gain further knowledge regarding the risks involved. Leverage should be used wisely.


Platinum 2.21.21Platinum looks like a SOLID BUY. Plus the premiums is not half bad. at least its not 25 percent like silver. it will hit 2k this year

Platinum will not upset youFundamentals is supportive, i.e. hydrogen.
From a technical POV, the trend line is important.
Above is pretty bullish.

Platinum going to 1500Possibility of a small pull back on the way but expecting to hit 1500 in the next few months.

Platinum - if history tells us anythingLook at the recent 3 $100 +/- drops for the metal. What the market tells us is that each time after these kinds of painful swing the market will follow up with sharp positive correction to the upside.
For now the trend is still up with the 200 EMA below the priceline, I would rather be a believer that history should repeat itself.
Disclaimer, this is only for entertainment and education purposes and doesn't serve by any means as a buy or sell recommendation.
Personally I hold both long term long positions and occasionally short term short position, for disclosure purpose.


Go platinum being bullish for MANY YEARS and now it is finally having its day now. Unfortunately I sold some of the shares to participate in the "silver squeeze" for which I regret so much that I don't have as much Platinum as in 2 weeks ago.
Will gradually buy back my PT shares with market dip or not. Seasonality wise PT will outperform in the next couple of month.
Technically it is very bullish with the price broke out of the super long term trendline resistance. Again it is a super depressed metal and it should be worth many multiples from this level IMO.
Disclaimer, this is only for entertainment and education purposes and doesn't serve by any means as a buy or sell recommendation.
Personally I hold both long term long positions and occasionally short term short position, for disclosure purpose.

Platinum hitting higher in the year of OXRead our recent post here
Actually, even if this year is the year of Mouse, Monkey, etc , it will still goes higher , hahaha. The uprise has nothing to do with the year , I mean according to the Chinese Lunar New Year zodiac sign. If you believe this year your wealth luck is not good because you "clash" with some spirits and thus you avoided buying stocks and bonds, etc, only you will have to bear the consequences of the result. I cannot guarantee you will make a profit this year but like I always say, we must be responsible with our own money. We invest based on what we know and what we don't know, we can spend time to find out more.
But if we choose to believe in these zodiac signs and not invest at all, then it is also good if it makes you at peace. Having wealth and no peace is not good. What's the point if you made a 1000 bucks but keep checking your phone to see the results ? Or you can't sleep at night , turn and toss in the bed ? Is that what you want or would you rather have a good night sleep without the 1000 bucks in your bank account ?
I will be waiting for the pull back to end before adding more to this commodity!


PLATINUMSaturday, 13 February 2021
19:09 PM (WIB)
Platinum still in a bearish retracement on Monday, 15 February 2021 to the support lines, and start rising again.
Best regards,
RyodaBrainless
"Live to Ride and Ride to Live"

PLATINUM breaking out Macro economic climate Suport the end of metals manipulation.
"loss of confidence in government produces monetary crisis Monetary Crisis, pushes metals higher."
M. Armstrong.
Political self destruction and ruin of the republic causes loss of confidence in government.
this is simple platinum.
I have matured a little as a technician. this rule set combines Gann fan , Fibonacci levels ( zoom out on the 2 day chart ) and fitted Ellipses

PlatinumThursday, 11 February 2021
19:50 PM (WIB)
Platinum will move lower to bargaining correction move to point 1188. From this point, will move higher again.
Best regards,
RyodaBrainless
"Live to Ride and Ride to Live"

Platinum Multi-Timeframe analysisHello Traders, here is the full analysis for this pair, let me know in the comment section below if you have any questions, the entry will be taken only if all rules of the strategies will be satisfied. I suggest you keep this pair on your watchlist and see if the rules of your strategy are satisfied.


History RepeatedMagnifying glass ~= Magnifying glass.
This is a fractal prediction suggesting PLAT will make a similar pattern to 2000 to 2009.
In a world gone mad, anything is possible.


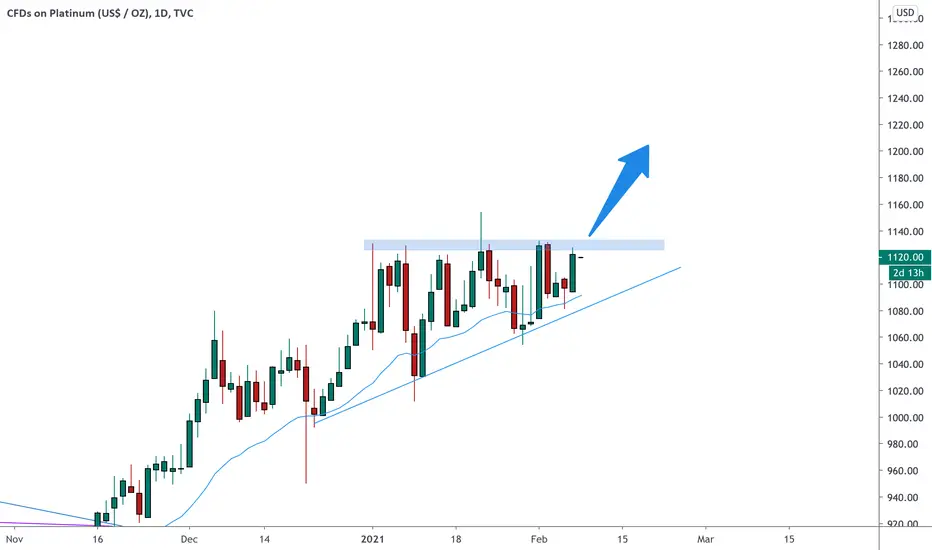
PLATINUM on an ascending triangle 🦐PLATINUM on the daily chart is consolidating below the 1130 resistance structure.
The price is creating an ascending triangle between the ascending trendline and the resistance.
According to Plancton's strategy, if the conditions will be satisfied, we can set a nice long order.
–––––
Follow the Shrimp 🦐
Keep in mind.
🟣 Purple structure -> Monthly structure.
🔴 Red structure -> Weekly structure.
🔵 Blue structure -> Daily structure.
🟡 Yellow structure -> 4h structure.
⚫️ Black structure -> <4h structure.
Here is the Plancton0618 technical analysis , please comment below if you have any question.
The ENTRY in the market will be taken only if the condition of the Plancton0618 strategy will trigger.
Platinum- 1300 next?After breaking 1000 figure resistance and reconfirming it as support, Platinum was on the run with the price gaining more than 20%.
Now the price is 1212 and the road is clear to 1300 next major resistance.
Buy dips can be a good strategy and I expect 1100 to be strong support.
