XRPBTC - EQ 📈📉XRP is currently creating a tight range after a huge move up. it can still be a bullflag and if we can break major resistance, i expect us to move up fast +30%
If we break bear then XRP probably will start it's weekly consolidation.
Thanks for taking your time to check out my idea 😎😎! Often, my ideas are fast gone from the front page because there are so many ideas on the platform and the algo picks the one with more likes 🤖🤖. I think once I have around 20 likes/idea my idea will be shown in front 🥳🥳. It would be awesome if you could like my idea, (only if you really like it of course) 🤪! I believe that the more we can interact with each other, and share thought about an idea, the more we can learn! 👩🏫🧑🏾🏫👨🏻🏫
Furthermore, I made a challenge for myself, I will add 1 idea for every new follower🦹♀️ So if I have 1 follower each day, I will add 1 idea. If I have 10 followers, I will add 10 🏌️♂️ It’s fun for me and you! More followers = more ideas = powerful community! 💪💪💪 Besides, all the ideas are … FREE 🥳🥳🥳
⚠️⚠️ If you want to know how my previous ideas played out, > push the play button on my previous ideas and check it out 🕵️🕵️
Is there a ticker you want me to look into? Let me know in the comments below ⬇️⬇️⬇️
XRPBTC trade ideas

BTC/USD Breakout imminent In the next hours we can see a big Breakout from the symmetrical triangle.

xrpbtchi friends. xrp is at the end of its dynamic downtrend and soon we should see a strong pump in it.


XRP - VISA monthly
The thriving Ripple does not have artificial pumps at such events, making it prudent to watch the trend closely. The partnership with VISA is worth keeping in the back of your mind - sorosz

XRP - VISAThe thriving Ripple does not have artificial pumps at such events, making it prudent to watch the trend closely. The partnership with VISA is worth keeping in the back of your mind - sorosz

The PAST is the BEACON of the FUTUREGet a long position in the XRPUSDT. It is in the weekly time frame.

XRP/BTC Possible Elliott WavePossible Elliott Wave formation currently in phase 3 which should be the longest and most profitable.

#XRPBTC Signal
INTRO
First of all guys welcome we are starting our journey again, its been a rough road but we will rise for sure. If U guys get any question u can comment or DM me so lets start with the analysis, Today We are talking about Our Favorite Ripple.
Analysis
Alright lets start with the moving averages are bullish and retesting. Which is a really good signal, Lets talk about Volume currently at 2800BTC on Binance. May seems A Little high but let me tell you, this Coin is very popular I remember trading Ripple in 2017-2018, its nothing compare to that time.
The Plan
For me the stop is at 40% so I'm risking 5% Of my portfolio on this particular trade, To diversify my investments I'm analyzing other charts too you can Comment or DM to know more
ALL THE BEST GUYS

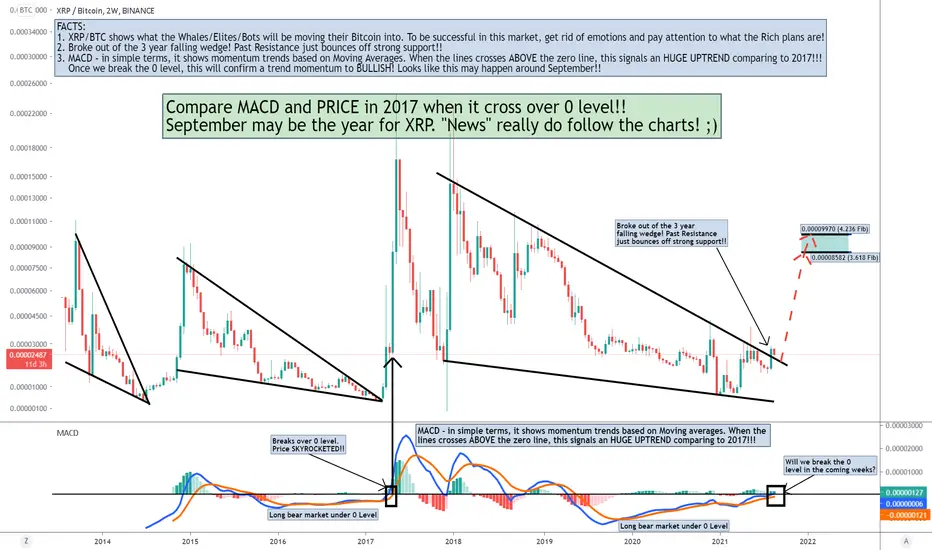
XRP/BTC - What happen in 2017 when MACD crossed over 0 Level?!Before reading, get rid of your moonboy mentality and no emotions for dips/corrections!
Lets look at the 2 week chart to get rid of shorter timeframe mess ;) Shorter timeframe is bearish but the best buying opportunity is when we are red!
People are so focused on the hourly/daily timeframe that they get emotional on every dip! Take a step back to the weekly/monthly timeframe and see why I'm so bullish now. Stop looking at the short term dips/rise. Short term is irrelevant for the move that is coming!
You can't be emotional in these markets (stocks, forex, crypto, real estate, etc.). You will lose this game following the news and doing what the majority does. News creates emotions. Everything you need to know are on the charts. News are manipulated by the elites, and they take advantage of our emotions. Stop listening the news and pay more attention to the charts. Don't follow the majority, because the majority will lose in the end! Also, don't buy the hype when everyone is buying.. instead buy the fear when everyone else is selling
Everything is on the chart! Cryptocurrencies are on the verge of exploding higher. Dips/Corrections are normal and needed in a bull market, and are buying opportunities! Huge gains opportunity in the coming months! Never trade blindly. Use multiple indicators to make calculated decisions. Trade with no emotions!
FACTS:
1. XRP/BTC shows what the Whales/Elites/Bots will be moving their Bitcoin into. To be successful in this market, get rid of emotions and pay attention to what the Rich plans are!
2. Broke out of the 3 year falling wedge! Past Resistance just bounces off strong support!!
3. MACD - in simple terms, it shows momentum trends based on Moving Averages. When the lines crosses ABOVE the zero line, this signals an HUGE UPTREND comparing to 2017!!! Once we break the 0 level, this will confirm a trend momentum to BULLISH! Looks like this may happen around September!!
Good Luck!
"If you can't beat the fear, do it scared!"
"Be fearful when others are greedy, and greedy when others are fearful!" - Warren Buffet.
"Markets are a device for transferring money from the impatient to the patient. - Warren Buffet
"Show me the charts, and I'll tell you the news." - Bernard Baruch
XRPBTC look delicious on weekly TFAfter inverted HS pattern and double bottom, it broke above very important resistance and made a nice retest.

xrpbtc weeklywhat a nice chart right? just wait for breakout and then enjoy th ride
let see it ll try cloud e2e cross

$XRPBTC reversalXRP printed a reversal candlestick at resistance. Looking to the left, XRP has been in this range from April to June, and could possibly spend some more time in here.

XRP ShortDailys:
XRP consolidating in a range, formed two LL's, now retesting the high of the range off an extremely bullish push.
Huge CCI spike, Likely to see Bearish Divergence if we push up again and hit the zone.
Supply zone, 6q.6 Fib of push down, EQ level
4H:
4H demand zone, Bearish Divergence.
May have missed this trade, first entry would have hit over the weekend and we've rejected strongly, daily Evening star.
Happy to sit orders up there though in case we do get another push.
No PA on Mex futures contract, gave SL a little more room to avoid liquidity and uncertainty. PHAT 10:1 though so might as well have a crack.

XRPBTCIs it possible a 300- 1000% increase in XRP vs BTC in 3 to 6 months?.
Note: Im a new to trading, my postings are not predictions but a beginners attempt to T.A. Hoping someone who knows could mentor me, pointing out why such thing is possible or not, and what mistakes are found in the chart.
Thanks in advance.

XRPBTC 🔥🔥🔥200 % + move coming? 🔥🔥🔥🔥What we see on the monthly chart is a very tight range! Also the bollinger bands are getting tight. This all led me think that a big move is coming...
200% sound crazy but if we just look at the history then we can see that it happened many times before, even much bigger moves.
Anyway XRP is coiling up for something big IMO.. The SEC case is getting closer to a end as well, coincidence? 🤫🤫
Thanks for taking your time to check out my idea 😎😎! Often, my ideas are fast gone from the front page because there are so many ideas on the platform and the algo picks the one with more likes 🤖🤖. I think once I have around 20 likes/idea my idea will be shown in front 🥳🥳. It would be awesome if you could like my idea, (only if you really like it of course) 🤪! I believe that the more we can interact with each other, and share thought about an idea, the more we can learn! 👩🏫🧑🏾🏫👨🏻🏫
Furthermore, I made a challenge for myself, I will add 1 idea for every new follower🦹♀️ So if I have 1 follower each day, I will add 1 idea. If I have 10 followers, I will add 10 🏌️♂️ It’s fun for me and you! More followers = more ideas = powerful community! 💪💪💪 Besides, all the ideas are … FREE 🥳🥳🥳
⚠️⚠️ If you want to know how my previous ideas played out, > push the play button on my previous ideas and check it out 🕵️🕵️
Is there a ticker you want me to look into? Let me know in a DM 📩📩

XRP starting to look greatFrom an FA perspective we are seeing more and more clamp downs from governments around the world, countries simply don't like to lose control of money.
Although I do like freedom but you have to realise the reality, the approach to work with the government may shine for a while.
Technically speaking we are now testing strong support area of 0.58~0.67, XRPBTC formed a beautiful monthly falling wedge as well.
*This is just a trade setup that is yet to co, but all we need from here is a strong reversal and will be looking to break that downtrend slope around $2, and hopefully with breakout of that falling wedge on the $XRPBTC, now would be a good time to start accumulating down the road.
### NOT FINANCIAL ADVICE###


XRPBTC FractalFractal shows lead up to May, looks like we have some more upside remaining after a slight dip in the market. LONG following a Short correction.

The pressure cooker is well cooked, are you ready? $XRPThe pressure cooker is welled cooked, are you ready?
XRP is back on track to reach 4500 satoshi in the short term. Perhaps within 8 days now. IF WE GET A DROP THIS NEXT COUPLE DAYS, IT WOULD BE TEMPORARY.
Weekly candle above the mid-line bollinger band.
Lined in red is about where we are if you look back historically
If the bullrun continues we will see all time high again and for the $$ value above $15.00
Best time to sell is when the MFI is overbought on the weekly. we are far from that

Ripple vs Bitcoin Long-Term Chart Since 2013 | 1000%+ PotentialOne of our followers asked for a long-term chart for Ripple vs Bitcoin (XRPBTC)... Here it is.
---
To me it looks very simple and straight forward.
The market moves in cycles, we have bearish and bullish cycles.
Below EMA50 we have bearish cycles.
Above EMA50 we have bullish.
After the 01 January 2018 price peak, we had the longest bearish cycle in Ripple's (XRPBTC) history. Ending now.
In exchange, we are likely to experience the strongest bullish cycle next.
With follow up from the bulls, the charts technicals support this, we will see 500% to 1,000% within the next 3-12 months.
In a bull run scenario, after many months of sustained growth (higher highs and higher lows), a mania/euphoria phase can be experienced that produces numbers that are off the chart.
We normally don't trade based on this and just take it as an extra but this is surely a possibility.
Disclaimer:
This is not financial advice.
This information is shared for learning and entertainment purposes only.
Do your own research before trading.
I am just sharing what I see coming from this chart/my opinion.
Thanks a lot for reading.
Namaste.

XRP/BTC & XRP/ETH Daily AnalysisXRP it's look extremey bullish in both ratios in Daily timeframe.
Now, looking the H4 timeframe in both ratios, it's bullish in Bitcoin and Ethereum ratios.
So, I don't have any more to say, it's bullish!!!

Ripple Can Continue Growing... Bullish Chart SignalsHere we have the XRPBTC chart (Ripple vs Bitcoin).
Just as we mentioned with DATA and STORJ, XRP is trading above all EMAs.
The longest one being EMA500 and this level was conquered yesterday. (0.00002050).
The RSI is super strong at 77 and the MACD above zero while trending higher, with plenty of room still left available for additional growth.
Based on how things are looking, Ripple can continue to grow.
Additional details/targets marked on the chart.
130% mapped with lower targets and support levels as well.
Namaste.
