XRP is just getting started. XRPBTC chart has lots of room left.XRP has made some spectacular moves since the "Trump election pump" began on November 4, 2024, but we haven’t seen anything yet. Bitcoin has been absorbing hundreds of billions of crypto investment dollars during this timeframe, but when money starts fleeing Bitcoin in search of more undervalued assets, XRP will be the prime beneficiary.
Bitcoin is obsolete and is being rejected by countries around the world as a consideration for strategic crypto reserves. ETH is too energy-inefficient and costly to use. XRP is the only viable option. Plus, with RLUSD, the ability to on-ramp or off-ramp has never been easier or more efficient than it is right now.
Get ready!
Good luck, and always use a stop-loss!
XRPBTC trade ideas

Buy dips on XRPBTC ready for another big leg up
big r/r trade that allows for wide stop, great oportunity here


You get this opportunity once in 4 yearsHelloOOoooo
this one of the safest entries for XRP
if you look at XRP/BTC chart you will see this is the most important level since 2014!
last time CRYPTOCAP:XRP bounced from it was in 2020 1400 days ago
also, we have bullish RSI and MACD divergence on weekly timeframe
imo XRP going to pump to 0.5 FIB level which is about 400% from here
good luck!

XRP will increase in BTC valueThe xrp btc charts are telling me that the xrp is not over, i will take most of my profit at the 702 retrsacemnt. XRP price towards dollar will be between 9-11 dollars if btc not increases to mcuh from here.

XRP/BTCCup and handle formation now complete of XRPBTC.
Targeting a 1:1 ration for next leg up. Of BYC holds its current level. We should see decent gains for XRP.

XRP/BTCCup and handle formation with the handle now complete. Target of a 1:1 ratio mid February for the next leg up.

Ripple / BitcoinHere’s my XRP in sats targets. We’re breaking out from an overhead resistance, and we should retest the top of the range, before coming back down to retrace the breakout zone. It doesn’t mean it comes all the way down, but there is a target there, which is land on top of the prior overhead. Good luck. I’m calling $30, sell $28 on this initial pump

XRPBTC This is how you can play XRP's strength.The XRPBTC pair is rising parabolically since November as XRP has been massively outperforming Bitcoin.
This 1week chart shows the pair's price action since August 2013 and that is somewhat a Rectangle.
Even though the price has only crossed the 0.5 Fibonacci level twice in 5 years before this week, it appears that the double bottom formation can alter that and with incredibly strong fundamentals for XRP, bring it back to the glory days before 2017.
A sound trading plan would be to keep buying XRP until the pair reaches the 0.786 Fibonacci level, where historically it has been a good level to sell and switch to BTC.
Four times BTC regain its strength and outperformed XRP there.
Even though it can go higher, it is worth the risk selling XRP and buying BTC on the 0.786 Fib, all the way to at least the 0.382 Fib if not 0.236.
In times of clear trends, paying attention to this pairs can be enormously profitable.
Follow us, like the idea and leave a comment below!!

XRP/BTC pump followed by 200 day cool off, then pump again
Been here for a while (2016) and got out at $3.25 in 2017, rebought at .30 in 2022. Basic TA with a bull pennant shows the flagpole getting really close to my first target level on xrp/btc. There is potential to hit the higher level as well where my solid bright red line is around .000246btc/xrp
likely we see the dotted line at .000123btc/xrp
2017 repeat seems highly probable
lmk your thoughts

Bullish XRP - XRP/BTC Chart - Weekly Time FrameXRP/BTC has broken out vs Bitcoin on the Weekly chart. This seems to be true no matter how you draw the lines too. The red line in the image in particular had several attempts made before finally breaking. So it was a strong resistance level. XRP broke out and re-tested the level perfectly. A bullish move upwards for XRP should continue in the coming weeks or months.
What this means is that XRP will be a better investment than BTC. XRP will make up some ground compared to BTC in terms of market cap.
Note: This agrees with my monthly analysis for XRP/BTC also. See link to related publication. Both are on high time frame charts which makes them more reliable, but they may take a long time to fulfill.


XRPBTC pair flirting with a bullflag breakoutCurrently retesting the top trendline of the bullflag. It hasn’t tested this zone much so resistance is very possible to hold for the moment however I expect that resistance will likely be fairly temporary. *not financial advice*

XRP/BTCIf the XRP/BTC 4H chart shows a breakout and then rises by 50%, it could indicate a strong bullish trend and the start of a new market phase. Such a significant increase would likely boost confidence in XRP, especially if it's supported by increased demand or positive fundamental developments.
A 50% surge could also signal a major shift in market sentiment. If XRP strengthens relative to Bitcoin, it could influence other altcoins, with investors potentially moving towards XRP in search of better returns.
However, it’s important to remain cautious, as such rapid increases are often followed by volatility and quick corrections. This might just be a temporary rally, and it's crucial to closely monitor market conditions and any news surrounding XRP and Bitcoin to get a clearer picture of the future direction. Overall, while a 50% rise is promising, traders should maintain solid risk management strategies.
NFA

$XRPBTC - 3 white solders? XRPBTC appears to be forming a bullish pennant, suggesting a potential continuation to the upside after consolidation. If we see the formation of three consecutive green candles with higher highs and higher lows (known as “three white soldiers”), it could signal the beginning of the next impulse wave.

All You Need To Know About XRPXRP chart cant say much __ but the pair is a definite reference to predict the present forward
Possible 30 -50% haircut here before IF BO and when it does IF it does it will go to double digits.

XRP/BTC RangeXRP/BTC has a very simple range pm the weekly. I would like to see a big flash dump before making any new move higher, especially considering RSI has reached around 88. To keep momentum around such a high RSI, I think it will need to see a big pullback into liquidity for a boost into new highs.

XRP/BTC pull back after runQuick Take!
XRP currently showing multiple bearish indicator divergences and failing to break key resistance at 2485. Looking at a price target of 2195 and 2049.
As always, keep those stops tight!

XRP's oscsillating behaviorBrief intro
The 22nd of December 2020 the SEC sues XRP; claiming that Ripple conducted an unregistered securities offering by selling XRP, which they classified as a security, without proper registration or exemption.
This is important for us to note before we go forward, because it is one if the key reasons that we have seen a semi-halt in the returns of XRP relative to BTC and ETH.
The stationary timeseries of the returns of XRP
Se notice that both for ETH as well as BTC that the XRP returns tend to move in a non-cyclical oscillator within a certain range.
I believe that the outcome of the SEC's case against XRP will move the oscillator to a new regime, like we saw after december 2020 where the SEC started it's case against Ripple
Using this theory you could get an overview of when XRP is likely to outperform ETH or BTC in the mid-term. Make sure you are aware of external market factors if you use this method though!

Bullish XRP - XRP/BTC Chart - 1 Month Time FrameThere are 2 chart patterns coinciding on the XRP/BTC chart for the monthly time frame.
Pattern #1:
Falling Wedge pattern with a target of 0.00010612
Target = 398% Increase
Pattern #2:
Double Bottom pattern with target of 0.00007199
Target = 269% Increase
Note: This is very reliable trade since it's the monthly TF, but it could also take very long to play out. Expect XRP to catch up to Bitcoin in the coming weeks or months!

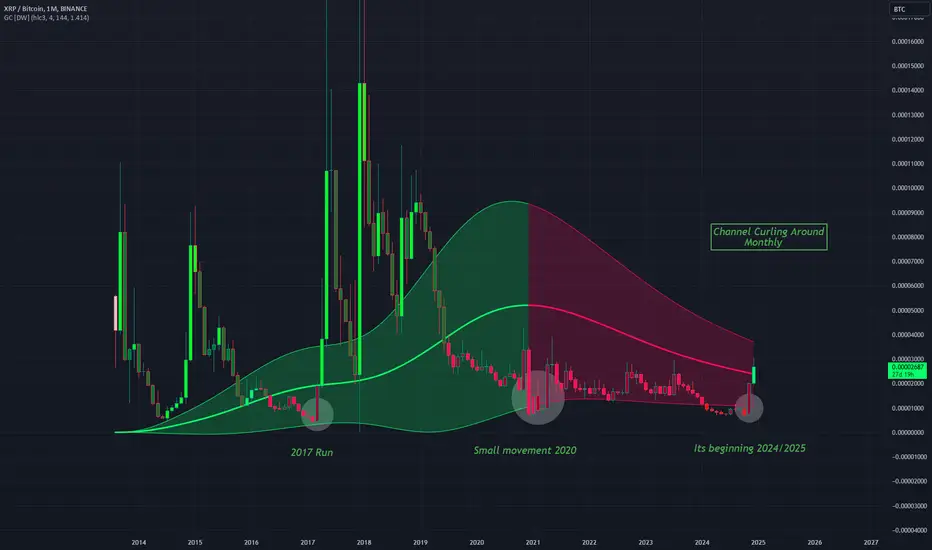
XRPBTC - A Look At the Gaussian ChannelThe Monthly channel is slowly curling itself around as the bulls gain momentum
As this turns green this channel, the bulls will come back with force.
I'm bullish on XRP right now and think we will see the run very soon.
All the significant runs have occurred when the bottom of the Channel has been touched.
XRPBTC - 2802 Day Bear Market As of now we have seen one of the largest moves since the 2017 run on XRP
Price on this chart has barely even moved relatively to the 2017 run, suggesting that XRPUSD has a lot of steam left.
A very bullish state for XRP.
2802 days since we have seen action like this!
I'm not including the 2020 / 2021 run as it was a false run in a way for XRP which is also evident on this chart.
