XRP Bullish against BTCI roamed the XRPBTC chart and found this little nugget, it shows a potential of 600% pump against bitcoin for XRP.
Alt season is here, the bottom is most likely in thanks to a bearish Dollar (topped out)
Long
XRPBTC trade ideas

XRP BULL AGAINXRP/BTC bull cycle again happen soon because of ending lawsuit with SEC.
XRP provide solution for trillion dollar cross payment market that why XRP stand in top 10 with SEC lawsuit

TIME TO PAY ATTENTION!!Its a perfect descending broadening wedge
Red line = entry
Green line = target

XRPBTC 'D' - Ripple Making Gains on BitcoinShowing a strong Buy signal from Crypto Tipster v2 within the lower half of a near perfect symetrical triangle after touching and rebounding off the lower edge - all good signs for a quick 8% long trade!
We've had a couple of really good short trades within XRPBTC recently from Crypto Tipster v2, is this Long going to be another quality trade before reaching the end of this symetrical triangle?
Where do you think the price will head once we reach of the end of this squeeze?

XRP (Y22.P4.Video1). XRP story so farHI All,
#XRP #Ripple
We look at the weekly chart and what the big picture is looking like and then dive into the daily and 4 hrly trading approach.
All the best,
S.SAri

XRPBTC - Reversal signsXRP VS BTC is printing a reversal sign and we are almost ready for a 200% pump


XRPBTC Intraday Technicals 18 November 2022The intraday chart of XRPBTC is stuck in the range between 0.000022 BTC and 0.0000234 BTC.
There is no momentum to move up, however it keeps rejecting 0.0000225 BTC intraday support.
XRPUSD is mirroring the price action of XRPBTC and sitting on $0.38 level since yesterday.
0.0000234-0.0000248 BTC is the area where we can see some slingshots later today towards during CME market closing.

XRPBTC Daily Chart Technicals 18 November 2022XRPBTC and XRPUSD moved bullish yesterday and printed green candles in the daily charts.
XRPBTC is teasing 0.0000229 BTC.
We need a strong bullish closing in the daily chart above this level, for XRP to gain some strength to move up.
XRPBTC continues to test 0.0000229 BTC and today’s daily candle has some bullish pressure in it.
A failure to break 0.0000229 BTC will lead XRP towards 0.0000211 BTC.
The next resistance in the XRPBTC daily chart is 0.0000259 BTC.

The XRP bull runXRP is currently at 25% of its bull run
Long entry: 0.00002200 btc
Take profit: 0.00050/0.00035 btc
This is my personal opinion and this is not a financial advice! Good trading!

Cripple might be bullish af from here. Fibby and trendline set up im long af will just cut if we're that bearish but gotta take the chance. Stay dynamic


XRPBTC - GANN KNOWS!Applying the Gann Fan from the extreme low and the extreme high, and analyzing the intersections, we can begin to see (clearly) where the market has been, and maybe, where it's going!!
Keep in mind, the $1.48 & the $2.85 are a couple of targets that I'll be keeping an eye once price begins to climb out of this long winded rut!
For now, the price is UP and if it continues, I'll be interested to see how price will handle the $0.77 cents area!
(Additionally, I'm leaning into the idea that Bitcoin drops while XRP pursues the $0.77 cent range)
Cheers!

XRPBTC Diamond Big Enough To See On The Monthly ChartWe have a Diamond pattern forming at these lows here on the Monthly XRP Chart. Diamonds are inherently Neutral Patterns but given the fact that XRP is currently sitting closer to Horizontal Support than it is from Resistance; I'd say the edge is leaning somewhat more towards the Bullish Scenario Here.
I'll be Posting a Macro Chart for the XRPUSDT Pair soon the compliment this setup and when i do it will be in the related ideas section below.

XRPBTC - Bullish ExpectationsInverted H&S present on chart
We are yet to experience the right shoulder arm which is a bullish period for price
This bullish assumption is support by a trend line in white, however price is still within a down channel
I expect XRP to perform well into the next year

XRP / BTCRecent XRP gains against bitcoin… signs of ripple strength
Chart Overlaid with:
- daily pivot levels
- Fibonacci extension
- MA 50,200
Daily Timeframe
See my earlier post for XRP analysis

XRPBTC, Tripple three combination completedXRPBTC, Tripple three combination completed.
See how it goes by Elliott wave theory.
This is remarkable price action had followed tripple three correction combination

Using Support and ResistanceScott Challenge-
Support - Resistnace in higher timeframes.
BTC is going to go down

XRP breaks out of 18 MONTH TRENDLINE RESISTANCEXRP/BTC is looking bullish. We just had an 18 month trendline resistance broken. One that held us down all the way from May last year. you know what they say, the longer the base, the higher into space!
this thing is gonna rip. We just had a good sign of strength breakout with high volume.
On top of this breakout we have more confluences of strength as the pair is holding above a critical level the 200 week moving average. It held us down for the last year but now we are finally above.
Macd crossing looks great
One key thing is that if you look at the btc dominance chart it is teetering around its multi year support level. I think it is going to crack and breakdown leading to an alt season and xrp finally having its turn.
Give a follow if you like my analysis!


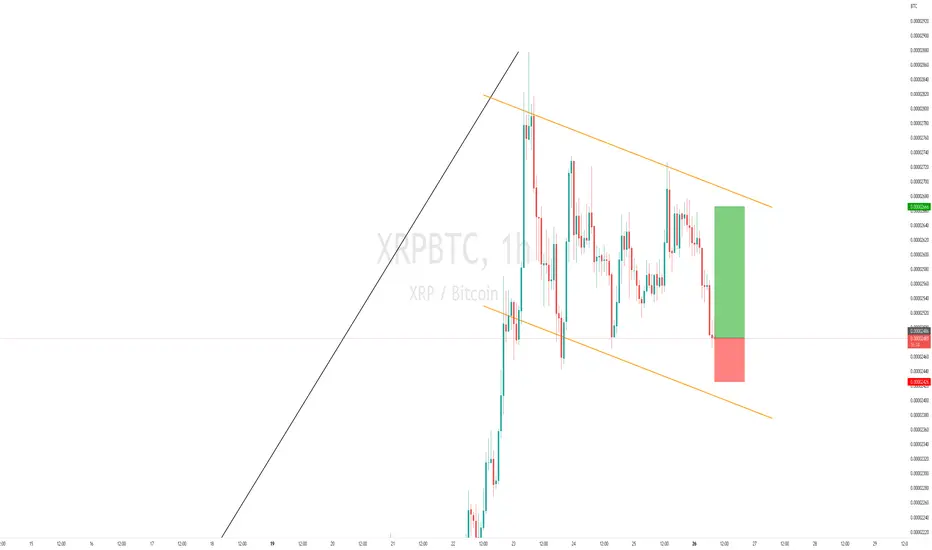
XRPBTC dip buying with view to break higherTrade Idea: Buying XRPBTC
Reasoning: Potential bullish flag formation on longer term chart with support at lower end
Entry Level: 0.00002486
Take Profit Level: 0.00002666
Stop Loss: 0.00002426
Risk/Reward: 3:1
Disclaimer – Signal Centre. Please be reminded – you alone are responsible for your trading – both gains and losses. There is a very high degree of risk involved in trading. The technical analysis, like all indicators, strategies, columns, articles and other features accessible on/though this site is for informational purposes only and should not be construed as investment advice by you. Your use of the technical analysis, as would also your use of all mentioned indicators, strategies, columns, articles and all other features, is entirely at your own risk and it is your sole responsibility to evaluate the accuracy, completeness and usefulness (including suitability) of the information. You should assess the risk of any trade with your financial adviser and make your own independent decision(s) regarding any tradable products which may be the subject matter of the technical analysis or any of the said indicators, strategies, columns, articles and all other features.
$xrp- updatethis bubba does'nt care about fomc
settlement is a done deal imo
announcement should make this rip
holding and doing nothing at times is best..
blue line at the minimum imo
