XRPETH trade ideas


Looks impossible in this moment maybe!In case that we will have a big price climbing of eth after hard fork, this scenario is very possible!!!

A second Chance to Buy in XRPETH...Technical analysis:
. RIPPLE/ETHEREUM is in a range bound and the beginning of uptrend is expected.
.The price is below the 21-Day WEMA which acts as a dynamic resistance.
. The RSI is at 38.
trading suggestion:
*There is still a possibility of temporary retracement to suggested support line (0.002169). if so, traders can set orders based on Price Action and expect to reach short-term targets.
*If you missed our first HUNT, you have a second chance to buy above the suggested support line (0.002169).
Entry signal:
Signal to enter the market occurs when the price comes to " Support line " then forms one of the reversal patterns, whether " Bullish Engulfing ", " Hammer " or " Valley ", in other words,
NO entry signal when the price comes to the zone BUT after any of reversal patterns is formed in the zone.
To learn more about " Entry signal " and special version of our " Price Action " strategy FOLLOW our lessons:
Trade Setup:
We opened 9 BUY trade(s) @ 0.00093753 based on '2-D Hammer' entry method at 08.11.2018.
Total Profit: 794321 pip
Closed trade(s): 525229 pip Profit
Open trade(s): 269092 pip Profit
Closed Profit:
TP1 @ 0.001080 touched at 08.17.2018 with 14247 Profit.
TP2 @ 0.001130 touched at 08.17.2018 with 19247 Profit.
TP3 @ 0.001172 touched at 08.17.2018 with 23447 Profit.
TP4 @ 0.001321 touched at 09.06.2018 with 38347 Profit.
TP5 @ 0.001555 touched at 09.12.2018 with 61747 Profit.
TP6 @ 0.002349 touched at 09.21.2018 with 141147 Profit.
TP7 @ 0.003208 touched at 09.21.2018 with 227047 Profit.
14247 + 19247 + 23447 + 38347 + 61747 + 141147 + 227047 = 525229
Open Profit:
Profit for one trade is 0.00228299 (current price) - 0.00093753 (open price) = 134546 pip
2 trade(s) still open, therefore total profit for open trade(s) is 134546 x 2 = 269092 pip
All SLs moved to Break-even point.
Take Profit:
TP8= @ 0.003850
TP9= Free

A second Chance to Buy in XRPETH...Technical analysis:
. RIPPLE/ETHEREUM is in a range bound and the beginning of uptrend is expected.
.The price is below the 21-Day WEMA which acts as a dynamic resistance.
. The RSI is at 30.
trading suggestion:
*There is still a possibility of temporary retracement to suggested support line (0.00218715). if so, traders can set orders based on Price Action and expect to reach short-term targets.
* If you missed our first HUNT, you have a second chance to buy above the suggested support line (0.00218715).
Entry signal:
Signal to enter the market occurs when the price comes to "Support line" then forms one of the reversal patterns, whether "Bullish Engulfing" , "Hammer" or "Valley" , in other words,
NO entry signal when the price comes to the zone BUT after any of reversal patterns is formed in the zone.
To learn more about "Entry signal" and special version of our "Price Action" strategy FOLLOW our lessons:
Trade Setup:
We opened 9 BUY trade(s) @ 0.00093753 based on '2-D Hammer' entry method at 08.11.2018.
Total Profit: 794275 pip
Closed trade(s): 525229 pip Profit
Open trade(s): 269046 pip Profit
Closed Profit:
TP1 @ 0.001080 touched at 08.17.2018 with 14247 Profit.
TP2 @ 0.001130 touched at 08.17.2018 with 19247 Profit.
TP3 @ 0.001172 touched at 08.17.2018 with 23447 Profit.
TP4 @ 0.001321 touched at 09.06.2018 with 38347 Profit.
TP5 @ 0.001555 touched at 09.12.2018 with 61747 Profit.
TP6 @ 0.002349 touched at 09.21.2018 with 141147 Profit.
TP7 @ 0.003208 touched at 09.21.2018 with 227047 Profit.
14247 + 19247 + 23447 + 38347 + 61747 + 141147 + 227047 = 525229
Open Profit:
Profit for one trade is 0.00228276 (current price) - 0.00093753 (open price) = 134523 pip
2 trade(s) still open, therefore total profit for open trade(s) is 134523 x 2 = 269046 pip
All SLs moved to Break-even point.
Take Profit:
TP8= @ 0.003850
TP9= Free

Trading opportunityPossibly the end of an ABC correction, on the 4h time frame we bounced above both our 10/21 EMA and crossed over on the MACD, The impulse waves up are only an idea what could take place but let's see if it can play out providing this is the end of the ABC correction, Take profits at resistance/support levels marked gl!.

There is a trading opportunity to Sell in XRPETHTechnical analysis:
. RIPPLE/ETHEREUM is in a downtrend and continuation of the downtrend is expected.
. The price is below the 21-Day WEMA which acts as a dynamic resistance.
. The RSI is at 32.
Trading suggestion:
. There is a possibility of temporary retracement to suggested resistance zone (0.00244800 to 0.00257350 ). if so, traders can set orders based on Price Action and expect to reach short-term targets.
Beginning of entry zone (0.00244800)
Ending of entry zone (0.00257350)
Entry signal:
Signal to enter the market occurs when the price comes to " Sell zone " then forms one of the reversal patterns, whether " Shooting Star " or " Peak ", in other words,
NO entry signal when the price comes to the zone BUT after any of reversal patterns is formed in the zone.
To learn more about " Entry signal " and special version of our "Price Action" strategy FOLLOW our lessons :
Take Profits:
TP1= @ 0.00224800
TP2= @ 0.00216600
TP3= @ 0.00206000
TP4= @ 0.00192800
TP5= @ 0.00157700
TP6= @ 0.00148200
TP7= @ 0.00126000
TP8= @ 0.00115200
TP9= @ 0.00091000
TP10= Free


Possible Falling wedge on XRPETHNot financial advice...if a falling wedge we could breakupward soon...we could also still have room to drop based on the size of the pole of the bearflag we broke down from

Big trading opportunity in longer termWho is Crypto holder and if reversal happen question is what is the best option for keeping our assets!
I like ETH very much but if we check correlations maybe ETH is not the best option now!
For ETH holders maybe pa this trade can make huge profit !Tp i did not write because i don't have right graph where i can see 1.618 and 1.218 extensions TP is there somewhere!Risk reward ratio very good for this trade!

How much steam does it have?Just a projection let's see if it can reach profit targets first level 399 and 2nd being 478, 267-269~ level should hold as natural support, breakout has already occurred just a matter of if it can continue climbing.

Indicator combination test - let's predict the futureNote: I'm testing a set of indicators. This ideas help me to verify my predictions afterwards. Please let me know your thoughts about this strategy, I'm very keen about other opinions or tips to improve.
NOTE I'm not a professional trader and my ideas are not meant as trading suggestions. It's your money, so think for yourself.
So, basically what im testing is the combination of the following indicators:
- MACD
- Stoch RSI
- RSI
- CCI (200)
- Ichimoku Cloud
Chart: XRP/ETH 4h
I'm analyzing every indicator on its own if it's a bearish or bullish signal. For the end result I'm adding all results.
MACD
Histogram and MACD shows a decreasing trend, Price is increasing -> divergence
--> bearish
Stoch RSI
Price is increasing but Stoch RSI can't build new highs -> Divergence
--> bearish
RSI
RSI is not really telling anything. It's moving between 30 and 70, which is the neutral zone. Also no trendline is visible
--> neutral
CCI (200)
CCI is moving near, but below 100 which is the neutral zone. The uptrend seems to be over since 18. Nov
--> neutral
Ichimuko Cloud
The Ichimuko Cloud consists of 5 single indicators I'm looking at:
1) Price is above the cloud -> bullish
2) "Future Cloud" is green (Lead 1 above Lead 2) -> bullish
3) Price is below base line -> bearish
4) Death Cross on 15. December -> bearish
5) Lagging Span -> upwards trend -> bullish ( not quite sure how to interpret this one correctly. yet.)
bullish 3 : 2 bearish
--> bullish
So, adding all results together:
MACD: bearish
Stoch RSI: bearish
RSI: neutral
CCI: neutral
Ichimoku Cloud: bullish
bearish 2 : 1 bullish
Bears win.
My conclusion:
- I will sell XRP now because i think the price will drop
- I will not buy XRP at the moment because the price will drop
I'll check this on the 1d and the 2h chart to verify the result.
Also I will try to identify possible support levels:
1) 0.00338879 -> i will sell half my XRP stock
2) 0.00333568 -> i will sell al of my XRP stock
Let's see :D

XRPETH - Buy on correctionXRP is still out performing ETH in short term. So, buy when price makes any corrections


One more push up! Let's trade it!We can see correlations between XRPETH XRPUSD ETHUSD and if we check better than we have one more good chance to trade with high risk reward ratio now!
Entry at bottom line of triangle
SL at red line and TP at the end of fifth wave i better not write any number for now,later i will write the numbers in comment
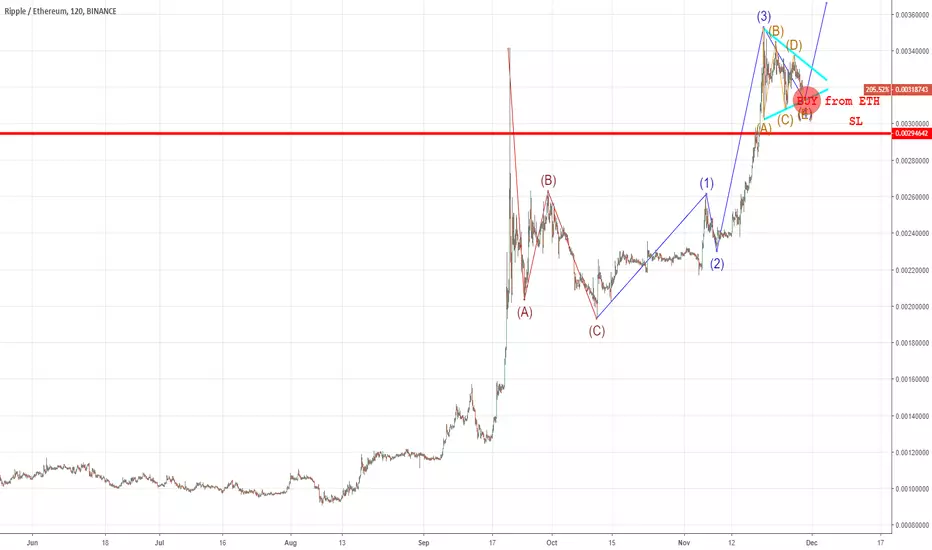
We are in Triangle and the fifth wave left only previous analysis
So let's finish this job well
We can clear see where we are now
We have a nice triangle and we know what comes after triangle :-)

Ready for next move up?It is a nice point to entry from ETH to XRP Now (part of our Crypto-capital in case if we are in ETH).

Next Move up XRPETH can start!If it will go up than this is very nice point for Entry from ETH to XRP if we want to keep part of our capital in crypto!

Possible Moon on $XRP in near. Coin traded 2 weeks in a narrow range with shake off long and short traders.

Increased Position in XRPHello,
This is my first trading view. Hope it goes well :D
I have increased my position in XRP. My position is made from 30% Bitcoin 70% Ethereum of my holdings. I am interested in the money transfer aspect of it, and I like the reach out to corporations. Not having a centralized wallet is lame though.
I don't do angles and lines on charts, other people do that well. I read their opinions. I trade on looking at fundamentals (which I get from other analysts on TV) and my feel. Crypto is about riding waves. I hodl and maintain my most of my assets in crypto. I have done this for 3 years so far.
Current portfolio composition:
BTC 16,2 %
ETH 50,7 %
BCH 9,6 %
LTC 0,4 %
XRP 23,2 %
Peace
Give me Licks :P
