XRP EOY Price @ $589!? More Like $0.17! (XRP Down Cycle)Since xrp's all time high, the price has been retracing ever since.
The percentage drop and the timeframe it took to drop is labelled on the chart.
The question is are we still in a bear market or have we reached the bottom?... hmmm
If we ARE still bearish then the previous patterns of the plumit of price in the past should be a good indication of where the price is proceeding to in the future.
Since all time high, xrp price dropped;
-76% over 33 days.
corrects then drops;
-60% over 48 days
corrects then drops;
-78% over 108-140 days - (This time frame is the outlyer)
Mean = -71.3% drop
Standard Deviation = +/- 9.8%
Upper Limit = -61.5%
Lower Limit = -81.1%
Therefore i believe that the price will drop another approx 71.3% (+/-) 9.8% before we see another bullish market turn around...
with all that being said,
i dont really know,
its a strange world,
the world of crypto ,
i could be wrong,
and i have before ,
but i hope for low prices,
so i can buy mor e.
Happy Hodling! :)
XRPEUR trade ideas

A trading opportunity to buy in XRPEURTechnical analysis:
. RIPPLE/EURO is in a range bound and the beginning of uptrend is expected.
. The price is above the 21-Day WEMA which acts as a dynamic support.
. The RSI is at 67.
. The RSI downtrend & The price downtrend in the daily chart are broken, so the probability of the resumption of an uptrend is increased.
Trading suggestion:
. There is a possibility of temporary retracement to suggested support zone (0.41700 to 0.30300). if so, traders can set orders based on Price Action and expect to reach short-term targets.
Beginning of entry zone (0.41700)
Ending of entry zone (0.30300)
Entry signal:
Signal to enter the market occurs when the price comes to " Buy zone " then forms one of the reversal patterns, whether " Bullish Engulfing ", " Hammer " or " Valley " in other words,
NO entry signal when the price comes to the zone BUT after any of the reversal patterns is formed in the zone.
To learn more about "Entry signal" and the special version of our "Price Action" strategy FOLLOW our lessons:
Take Profits:
TP1= @ 0.64700
TP2= @ 0.75600
TP3= @ 0.95900
TP4= @ 1.09100
TP5= @ 1.35700
TP6= @ 2.01000
TP7= @ 2.49900
TP8= Free


XRP I don t know englesh very well sory for that/ Xrp must go up for now noting tell us the price will go down

XRP will make a huge boom In my opinion xrp will make a huge boom ...look and say if you belive that to

XRP That line white is so important must look at her for the next move in my opinion will be upside like a boom

XRP Bullish scenarioHi there,
This is my vision on XRP if the bulls can overtake the bears in the coming weeks.
On the daily XRP is forming a bull flag with an ascending triangle and it's been finding support on the 200 daily. If it is to break out we will probably go above the previous high.
Now volume is important to give it momentum, xRapid adoption or speculation might cause this. Shorts are also picking up again so another short squeeze when we break resistance is also possible.
There are some mixed signals at the moment, we also see a double top which makes this look a bit like a bull trap.
There are points to be made on the bear and bull side. However oktober till december are historically good months for crypto so i'm leaning towards the long side here.
XRP makes a lot of vertical moves so it is important to keep an eye on this if it breaks out so we don't miss the opportunity.
We probably see this play out somewhere around the 15th.
Comments, critics, and different ideas are most welcome. So if you don't agree with me please let me know, i'm always eager to learn.


XRP 4hr timeframe EUROMost likely breakout to the upside coming very soon. Still correcting now in my opinion, waiting for bullish

XRP H&S and Bear flagHead and shoulders + bear flag on the hourly xrp chart.
If some good new comes out of SWELL we might see a nice bounce on the 200ema, also depends on what BTC is going to do.
Correct me if you think i'm wrong.

XRPEUR update! Update on XRP euro:
Correction still going on inside the ascending triangle?
or failed 3. impulse wave?
Bullish:
- Ascending triangle - breakout to the upside
- Golden Cross - increase in price
Bearish:
- failed 3. elliot wave? Dead cat bounce/bull trap?
- MacD in the negative - still correcting
- RSI decending - still correcting
Placing trading positions is always on your own risk and responsibility - this is not trading advice


XRP EUR breakout coming soon!Forming bull flag on the 4hr timeframe (ascending triangle). Most likely breakout to the upside coming very soon. Lets see what happens :)
This is not financial or trading advice! You trade on your own risk and based on your own trading plan.
Happy trading!

XRPEUR Long swing trade! Possible breakoutSwing trade idea, long.
You are responsible for your own tradings and investments, keep your risk management plans :) Happy trading!

XRP 4H In this idea, the two higher propability moves are presented. Trade carefully bearing in mind the possible market manipulation. Once profit gained withdraw the earnings to you bank account and keep enjoying profits.

XRP In the next weekTo be honest, this is my first attempt at anything like this. Most likely what I have posted here is any real revelation, but I am open to suggestions and tips for future ideas, posts etc.

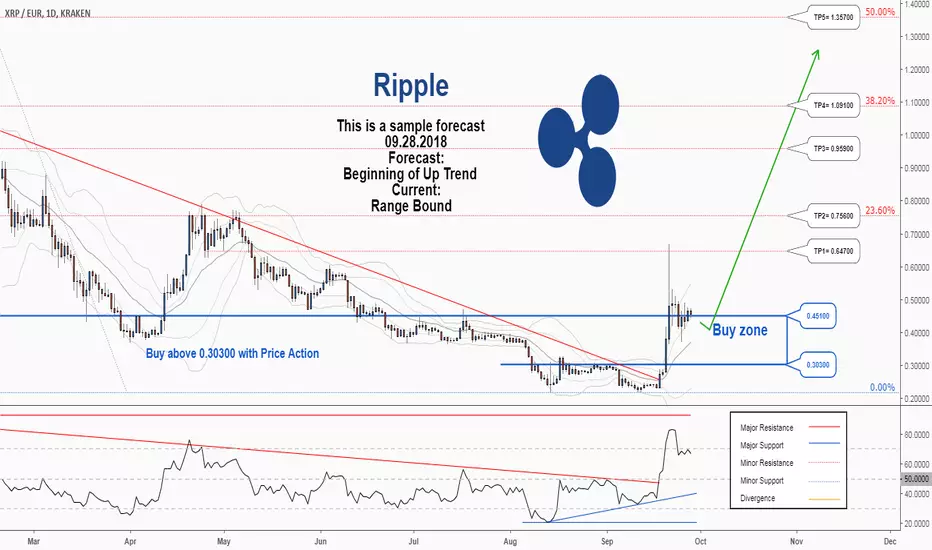
A trading opportunity to buy in XRPEURTechnical analysis:
. RIPPLE/EURO is in a range bound and the beginning of uptrend is expected.
. The price is above the 21-Day WEMA which acts as a dynamic support.
. The RSI is at 67.
. The RSI downtrend & The price downtrend in the daily chart are broken, so the probability of the resumption of an uptrend is increased.
Trading suggestion:
. There is a possibility of temporary retracement to suggested support zone (0.45100 to 0.30300). if so, traders can set orders based on Price Action and expect to reach short-term targets.
Beginning of entry zone (0.45100)
Ending of entry zone (0.30300)
Entry signal:
Signal to enter the market occurs when the price comes to "Buy zone" then forms one of the reversal patterns, whether "Bullish Engulfing" , "Hammer" or "Valley" in other words,
NO entry signal when the price comes to the zone BUT after any of the reversal patterns is formed in the zone.
To learn more about "Entry signal" and the special version of our "Price Action" strategy FOLLOW our lessons:
Take Profits:
TP1= @ 0.64700
TP2= @ 0.75600
TP3= @ 0.95900
TP4= @ 1.09100
TP5= @ 1.35700
TP6= @ 2.01000
TP7= @ 2.49900
TP8= Free
