XRP/EUR buy I will buy more and more ripple
This is not any investment advise. I just want to show the public my positions.
Enjoy my charts always :)
Hit a "like"
KRAKEN:XRPEUR
BULLISH BULLISH **MAYDAY MAYDAY** HOT ASSET+++
XRPEUR trade ideas


Ripple/EUR going upAfter another healthy horizontal period (highlighted), although shorter than the last one, we're going up again. The blue line signifies a gradual support line. The red bearish trend line has been well and truly broken and we're out of the short fall in value.
So it looks to me like we're going well above 1 XRP/EUR next.


Ripple/EUR: price to break out of "Ascending Triangle"-pattern?Pennant-pattern (see the two orange trendlines):
First of all, price broke out of a "Pennant"-pattern. This resulted into a price target of EUR 1.21
Calculation:
Between 12/12/2017 and 12/14/2017 price increased from roughly EUR 0.20 to EUR 0.76
The difference is 0.76-0.20=0.56
You add this difference to the price at which price broke out of the "Pennant"-pattern, which was EUR 0.65
This results into a price target of 0.65+0.56=1.21
Ascending Triangle-pattern (see the two blue trendlines):
At the moment price is a the top of the "Ascending Triangle"-pattern.
This pattern is a continuation pattern: price takes a breather from the previous increase. Also, the rising blue trendline indicates that even though price also decreases, the price decreases are getting smaller: price is being pushed to the upside
Bearish divergence price and RSI (see the two purple lines):
However, we spot a bearish divergence between price and the RSI: the price sets a higher high, but the RSI does not.
This means that the higher high of the price isn't confirmed by the RSI.
This indicates that the momentum is slowing down and, therefore, price increase may be halted.

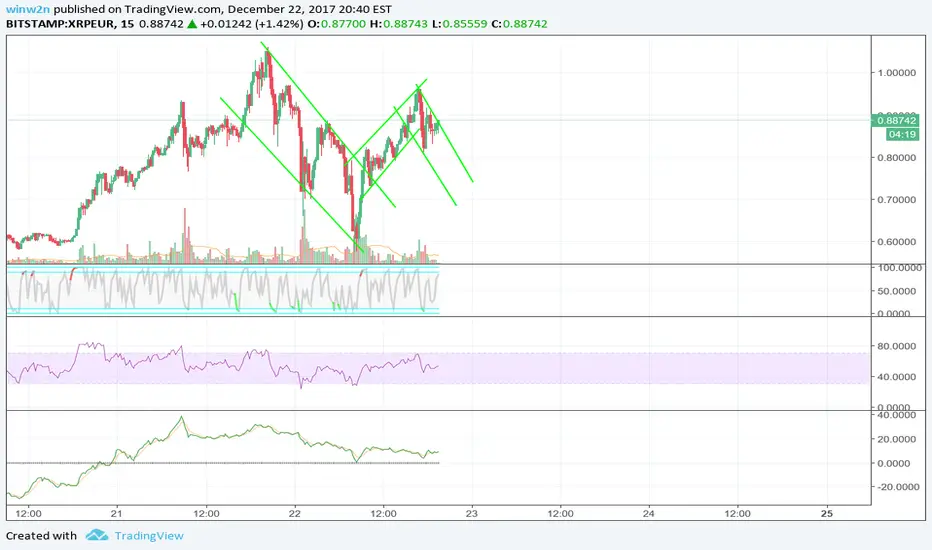
XRP EUR Bitstamp lets seeLets see if xrp can leave the channel again. I am hoping for a dip...
I think if it dips, then until 0.75


Ascending Triangle!This is such an easy indicator. It's basically free money! GET IN BOIS! 1 € on x-mas EZ!

XRP trading opportunityXRP is breaking out from a symmetrical triangle. Next resistance at 0.74 if broken next profit target 0.82.

ascending triangle guys, is xrp going to the €1 or higher!Xrp might hit the €1 or higher before new years eve!!!!

Possible H&S formation. Watch 0,625€ LEVELS!After a breakout bulls on XRP doesnt have power to push through. I am watching a possible H&S formation. There is a strong resistnace at 0,6500/50. Push bellow 0,6250 and we can see sell off to 0,48-0,52 leves

XRPEURBITSTAMP:XRPEUR is having huge trouble at major resistance line , always bouncing back to support or trend line. Hopefully BITSTAMP:XRPEUR going into escrow account untill the end of this year will help crushing that resistance line. With more good news like NYSE:AXP last month more people will recognize BITSTAMP:XRPEUR as a good investment and the price will rise.


XRPEUR Short Breakout ConfirmationMy first post anywhere related to trading as I'm really here to learn but I have been following this chart for the last day on the 4hr and 1hr time-frames to see which way it will break. Triangular patter was drawn in the wee hours before the break. Stoch-RSI, RSI and CCI all show overbought on the day frame so very likely to have some strength on the way down. The last two bars have both closed and opened lower after breaking the trendline so could be a good short down to the 0.618 or 0.5 Fib line.
Btw I bought in Ripple at 0.17 and my plan is to buy back after this move bottoms out and signals upward again. Would appreciate any thoughts on this.

Ripple set for new break outWith its recent lower highs and higher lows a funnel is created for future breakout.
Also the lower volumes and MACD seem to support this hypotheses.
However, will this break out correct the recent increase or go for the dollar mark?

Looking for completion of Elliot Wave pattern in RippleI know these less known crypto's suppose to hold great promise, but i am a little bit skeptic.
The lower the cap, the more prone the coin is to manipulation by larger holders.
That being said, let's look whether technical analysis applies.
I'm looking for completion of Elliot Wave impulse pattern followed by a correction pattern.
I expect Ripple to finish this pattern first before ripping higher.

3 support levels - you can choose ;)In pace of what we saw til now 0.30 EUR is good buy support in next 3 months.
S1: 0.4
S2: 0.35
S3: 0.3
